| Version | Date Released | Features and Enhancements | Resolved Issues |
|---|---|---|---|
| 5.0.11 | May 30, 2017 | ✓ | ✓ |
| 5.0.10 | May 11, 2017 | ✓ | ✓ |
| 5.0.9 | April 20, 2017 | ✓ | ✓ |
| 5.0.8 | April 8, 2017 | ✓ | |
| 5.0.7 | April 5, 2017 | ✓ | ✓ |
| 5.0.6 | March 28, 2017 | ✓ | ✓ |
| 5.0.5 | March 23, 2017 | ✓ | ✓ |
| 5.0.4 | March 6, 2017 | ✓ | ✓ |
| 5.0.3 | February 24, 2017 | ✓ | ✓ |
| 5.0.2 | February 20, 2017 | ✓ | ✓ |
| 5.0.1 | February 6, 2017 | ✓ | ✓ |
| 5.0.0 | January 27, 2017 |
Overview
Transact Insights 5.0.0 is Avoka's turn-key solution to transaction analytics that completes Avoka lifecycle of Design - Integrate - Transact - Optimize.
It comes with capabilities that will help
- Improve conversion rates for our customers
- Reduce the effort to complete an application form
- Improve user on-boarding experience
App Layout
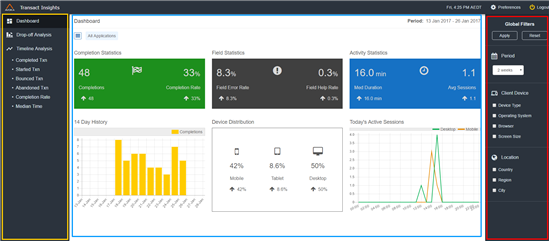
Insights App layout has the following components -
- A navigation panel (highlighted in yellow) on the left - can be used navigate from one analytics view to another. For instance this view is for "Dashboard". Other views include Dropoff and Timeline. More details on these views in the following sections.
- The view panel (highlighted in blue) at the center - where the actual analytics data is presented. The screenshot shown above is for the dashboard view. One or more application forms can be selected using the scope selector button at the top-left corner of the view.
- The filter panel (highlighted in red) on the right - can be used to apply filters to analytics data that is to be presented in the view panel.
Key Features
Dashboard
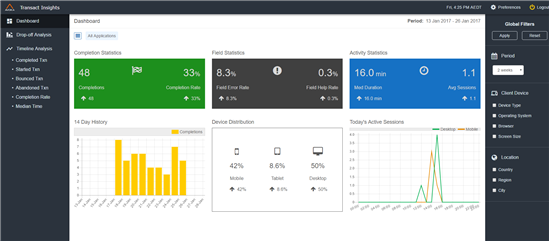
It provides an overview of key metrics that gives an indication of conversion performance. At one glance, you can know completion rate, field error and help rates, activity statistics, completion history, device distribution, and a visual on what today's activity looks like.
Drop off
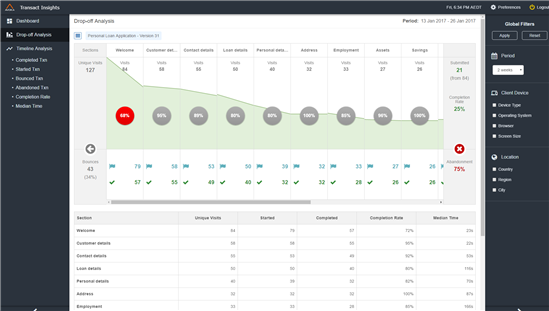
This is a detailed view of transactions for a particular application form version. It provides a visual representation of the conversion funnel across all sections of the application form.
Unique visits in the first column is the total number of transactions for the selected application form during the selected period and filters. Transactions that did start filling out the form is represented by Bounces. The visits number in the first section where the graph starts is the number of transactions that started interacting with the form. The green section of the graph represents transactions that completed that section and moved to the following section. It presents section level metrics such as Visits, Started, Completed, Saved. The percentage shown in the bubble at the center of the graph shows the drop-off of transactions in each corresponding section. It is the percentage of transactions that completed the section compared to the number that visited that section. The highest drop-off is color coded with Red. At the end of the graph, a summary is presented that captures the transaction status summary (Submitted, Conversion rate and Abandonment rate).
A table is displayed below the graph which presents various section level metrics including Unique visits, Started, Completed, Completion rate and Median time spent in each section.
Timeline
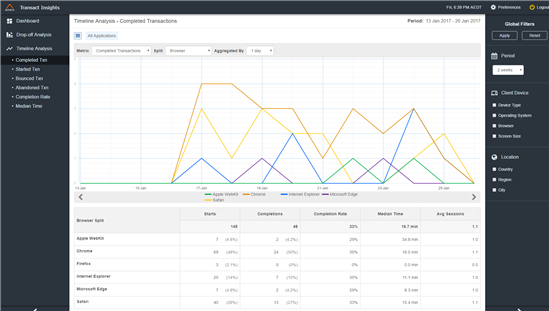
It presents a time-series graph of a selected metric. This view that shows how the selected metric varies over a selected period of time. Metrics include transaction status (Started, Bounced, Abandoned, Completed), Completion status, Median time spent filling out the form. The timeline graph can be split by transaction characteristics such as the device and browser used for transaction, and space used by the transaction. One of more application forms and multiple form versions can be selected for this view. If only one application form is select and more than one version of the form is selected for this view, the timeline graph can also be split for form version. The aggregation period for the timeline graphs can also be controlled using the "Aggregate By" drop-down where one or more suitable aggregation value is presented.
A summary table is presented below the timeline graph that provides the transaction status summary for the selected period of time. It includes metrics such as Started, Completed, Completion rate, Median time spent, and Average sessions taken for transaction to complete. If a split by option is selected, there will be one row of data for each split.
Data Filtering
Period
Set a date rate for all the views.
Client Devices
Select one or more of device types, Operating systems, Browsers or Device screen sizes and only transactions from those selected filters will be presented in all the views.
Location
Select one or more Countries, States or Cities and only transactions coming from those selected locations will be presented in all the views.
User Preferences
Insights users may set certain preferences for their account and this will be persisted across login sessions and applied to the data. This can be accessed by clicking on the "User Preferences" menu item available in the header bar of the App at the top right of the App.
General
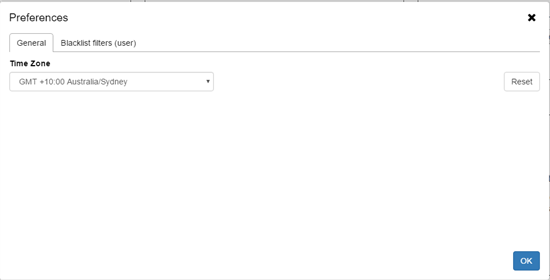
The "General" tab has Timezone preference setting. The selected timezone is applied to the dates used in the App will (Ex: Today's date shown at the top right corner of the App, the dates selected in the period filter will be of the selected timezone. The timezone can be reset to server default by clicking on the Reset button.
Blacklist filter
One or more blacklist filters may be set here. All views in the App will not include data that matches one of the blacklist filters configured through this tab. For instance, adding IP address 127.0.0.1 doesn't include data from transactions that were carried out from this IP address. Adding a browser such as IE or Safari in this blacklist will exclude all data from transactions that were carried out from those browsers. One of the useful blacklist filters to add is the Robot/Crawler that will exclude all data generated from a crawler or a search bot.
Release Details
5.0.11
Features and Enhancements
Transact Insights 5.0.11 is a maintenance release containing bug fixes and enhancements.
| Reference | Theme | Summary | Description |
|---|---|---|---|
| TID-962 | Metrics Improvements | Redefine Error and Help rate |
Implements a new way to show field error and help rate which is easy to understand for customers. With the new definition, Field Analysis view:
In dashboard Field statistics tile:
|
| TID-378 | Performance | Migrate to BigQuery Standard SQL | Migrate all queries from currently used legacy query format to BigQuery Standard SQL in order to leverage latest BigQuery query features |
Resolved Issues
You need to login to access this content. If you still don't have access after logging in, you can request it by posting a new question and selecting the access you need in the Type dropdown.
5.0.10
Features and Enhancements
Transact Insights 5.0.10 is a maintenance release containing bug fixes and enhancements.
This release includes implementation for a series of performance improvement strategies including smart caching and query optimizations to both reduce query latency and BQ resource utilization. With this release, all Insights views should be rendered in under 20 seconds in general and Timeline views in under 10-12 seconds for non-cached data. When the cache is hit, the response time for these views should be under 2-3 seconds.
| Reference | Theme | Summary | Description |
|---|---|---|---|
| TID-968 | Performance | Smart caching | Implement a pre-filter FormEvent table which can be cached and used across views that share or have an overlap in data that is queried |
|
TID-963 TID-976 TID-977 TID-978 TID-979 TID-980 TID-987 |
Performance | Investigate query hotspots and optimize for performance |
Optimizes queries to use less Google BigQuery resources and leverage Smart caching done part of TID-968. Optimizes sections query as part of TID-987 to utilize time_in_field column. |
| TID-986 | Performance | Update queries to use form_session.time_opened | Optimizes performance by leveraging on form_session.time_opened available in all events. |
| TID-984 | Performance | Use synchronous calls to reduce latency of Insights queries | Implements logic to use Bigquery synchronous query API for non-precache queries which can reduce the overhead of latency caused by waiting in queues with the earlier async implementation |
| TID-991 | Performance | Instance warm-up at deployment | Implements logic to instantiate minimum of one Insights Server when a new version of Insights is released. This avoids Insights performance degradation during new releases |
Resolved Issues
You need to login to access this content. If you still don't have access after logging in, you can request it by posting a new question and selecting the access you need in the Type dropdown.
5.0.9
Features and Enhancements
| Reference | Theme | Summary | Description |
|---|---|---|---|
| TID-771 | New Feature | Design and implement UI to display modal sections | Implements the ability to customize Drop-off view by selecting which sections should be displayed, allowing to set display name for sections, grouping sections and display aggregated data for the section etc. |
| TID-841 | Performance | Dropoff: Defer fetching of field-level data | Improves Drop-off view performance by deferring fetching of field level data. It helps to render the drop-off view before field level data is fetched |
| TID-960 | UX Improvement | Drop-off first column rework | Implements a better (and consistent with summary column) way to display first column of Drop-off chart. |
Resolved Issues
You need to login to access this content. If you still don't have access after logging in, you can request it by posting a new question and selecting the access you need in the Type dropdown.
5.0.8
Features and Enhancements
Transact Insights 5.0.8 is a maintenance release containing bug fixes and enhancements.
| Reference | Theme | Summary | Description |
|---|---|---|---|
| TID-945 | Traceability | Log performance stats for failed/aborted queries | Provides failed query information for debugging purposes |
| TID-942 | UX Enhacement | Automatic update of Insights App when a new version is available | Implements ability to automatically update Insights App code in Chrome browser if the cached files are of older version than the currently available version. |
5.0.7
Features and Enhancements
Transact Insights 5.0.7 is a maintenance release containing bug fixes and enhancements.
| Reference | Theme | Summary | Description |
|---|---|---|---|
| TID-896 | UX Enhancement | Show date along with the time as per set timezone at the top header bar | Provides date information in header bar |
| TID-897 | Metric Enhancement | Abandonment metric in field analysis | Changes the way Field Abandonment metric is defined by showing it relative to total Abandonment across all field of the form. This provides better value for customers to identify field issues relative to others. |
| TID-921 | UX Enhancement | Define a new standardized color palette for Insights App | Enhances user experience by providing a consistent color scheme across all parts of the App used to show Metrics, Charts etc. |
Resolved Issues
You need to login to access this content. If you still don't have access after logging in, you can request it by posting a new question and selecting the access you need in the Type dropdown.
5.0.6
Features and Enhancements
Transact Insights 5.0.6 is a maintenance release containing bug fixes and enhancements.
| Reference | Theme | Summary | Description |
|---|---|---|---|
| TID-725 | Traceability | Track Insights performance |
Implements ability to track and record query performance including data such as cache miss/hit, query executed, latency of query, number of records returned etc. |
Resolved Issues
You need to login to access this content. If you still don't have access after logging in, you can request it by posting a new question and selecting the access you need in the Type dropdown.
5.0.5
Features and Enhancements
Transact Insights 5.0.5 is a maintenance release containing bug fixes and enhancements.
| Reference | Theme | Summary | Description |
|---|---|---|---|
| TID-828 | New Analytics View | All txn view as a stacked bar charts |
Implements Bar chart for all transaction timeline chart with color coded statuses
|
| TID-644 | New Feature | Custom Milestone support | This implements the ability to collect and store custom milestones in Insights |
Resolved Issues
You need to login to access this content. If you still don't have access after logging in, you can request it by posting a new question and selecting the access you need in the Type dropdown.
5.0.4
Features and Enhancements
Transact Insights 5.0.4 is a maintenance release containing bug fixes and enhancements.
| TID-693 | New Analytics View | As a user, I want to see timeline view of all transactions for the selected forms | Implements a new view under timeline feature which displays all transaction status in a single line graph. |
|
TID-808 TID-760 |
New Metrics | Improved Abandonment handling including support for ineligible transactions | Implements handling of new Abandonment categorization in TM. Including AbandonedBounced, AbandonedIneligible and other subtypes |
| TID-817 | UX enhancement | View by field path |
This implements ability to see field analysis view by displaying field path instead of field names. This was introduced to handle cases where form uses dynamic logic to updating field labels.
|
| TID-775 | New Metrics | Add Saved and Abandoned count in drop-off views |
This implements the ability to show "Saved" and "Abandoned" count in each section in drop-off view.
|
Resolved Issues
You need to login to access this content. If you still don't have access after logging in, you can request it by posting a new question and selecting the access you need in the Type dropdown.
5.0.3
Features and Enhancements
Transact Insights 5.0.3 is a maintenance release containing bug fixes and enhancements.
| Reference | Theme | Summary | Description |
|---|---|---|---|
| TID-749 | New Metrics | Show number of fields metric in Drop-off views |
This implements the ability to show number of fields in drop-off and field analysis views
|
| TID-182 | UX enhancement | Timeline Chart - Weekly aggregate shows start of the week | Improves readability of timeline charts by showing the range of dates for each data point instead of either start or end date |
Resolved Issues
You need to login to access this content. If you still don't have access after logging in, you can request it by posting a new question and selecting the access you need in the Type dropdown.
5.0.2
Features and Enhancements
Transact Insights 5.0.2 is a maintenance release containing bug fixes and enhancements.
| Reference | Theme | Summary | Description |
|---|---|---|---|
| TID-727 | Application traceability | Improve backend logging | Implements logging which provides capability to analyse issues and bugs |
| TID-742 | UX enhancement | As a user, I want to quickly understand what a dashboard metric means without referring to documentation | Implements contextual help feature to assist Insights users with quick access to metric definition |
| TID-768 | UX enhancement | Show appropriate message to user when user has access to no Org or Space | When an Insights user doesn't have access to any ORG or SPACE, this implementation provides better UX by displaying appropriate message to the user |
| TID-781, TID-788 | UX enhancement | Feature and metrics naming improvements | De-clutters feature navigation panel with shorter and apt feature names. Improves readability in Dropoff chart |
| TID-787 | UX enhancement | Tooltip to improve readability | Implements tooltip for conversion rate in drop-off view |
Resolved Issues
You need to login to access this content. If you still don't have access after logging in, you can request it by posting a new question and selecting the access you need in the Type dropdown.
5.0.1
Features and Enhancements
Transact Insights 5.0.1 is a maintenance release containing bug fixes and enhancements.
| Reference | Theme | Summary | Description |
|---|---|---|---|
| TID-457 | UX enhancement | Add modal loading screen | For better UX, present a modal loading screen until the application is truly & completely initialized |
| TID-486 | Backward Compatibility | Increase robustness around form start | To support Pre-4.4 Composer forms which didn't have form_start support, this implements a fallback logic which helps identify "Started" status of transaction. |
| TID-741 | Data Quality | Ensure all queries use form_session.id for counting unique sessions | Several queries use request_log_key to count the number of unique sessions for a given transaction. This generally works, but is not technically correct. This enhancement ensure they are using form_session.id instead. |
| TID-216 | Security | Clear LocalStorage on insights logout | This work enhances Insights App security by clearing the browser local storage when the user logs out. This ensures that cached user preferences are not visible to other users logging in, and also ensures that filters do not carry over to different TM instances. |
| TID-710 | Security, Reliability | Ensure filters don't leak between TM instances | This work allows us to handle the case where the user accesses multiple Insights instances concurrently through different TM instance. With this implementation, filters are tracked per TM instance and Insights UI excludes filters that came from a foreign TM instance. |
| TID-717 | UX enhancement | UI enhancements |
This work implements Tooltip support where needed, handles escaped characters in field and section names and generally improves UI/UX.
|
| TID-738 | UX enhancement | Change order in metric drop-down | Improves UX by presenting more useful metrics at the top in metrics drop-down and timeline links in sequential order of transaction status |
Resolved Issues
You need to login to access this content. If you still don't have access after logging in, you can request it by posting a new question and selecting the access you need in the Type dropdown.


