User Interface Overview
Journey Analytics The behavioural analytics tool. | Analytics User | Latest Version Latest version 23.04.0 cloud hosted.
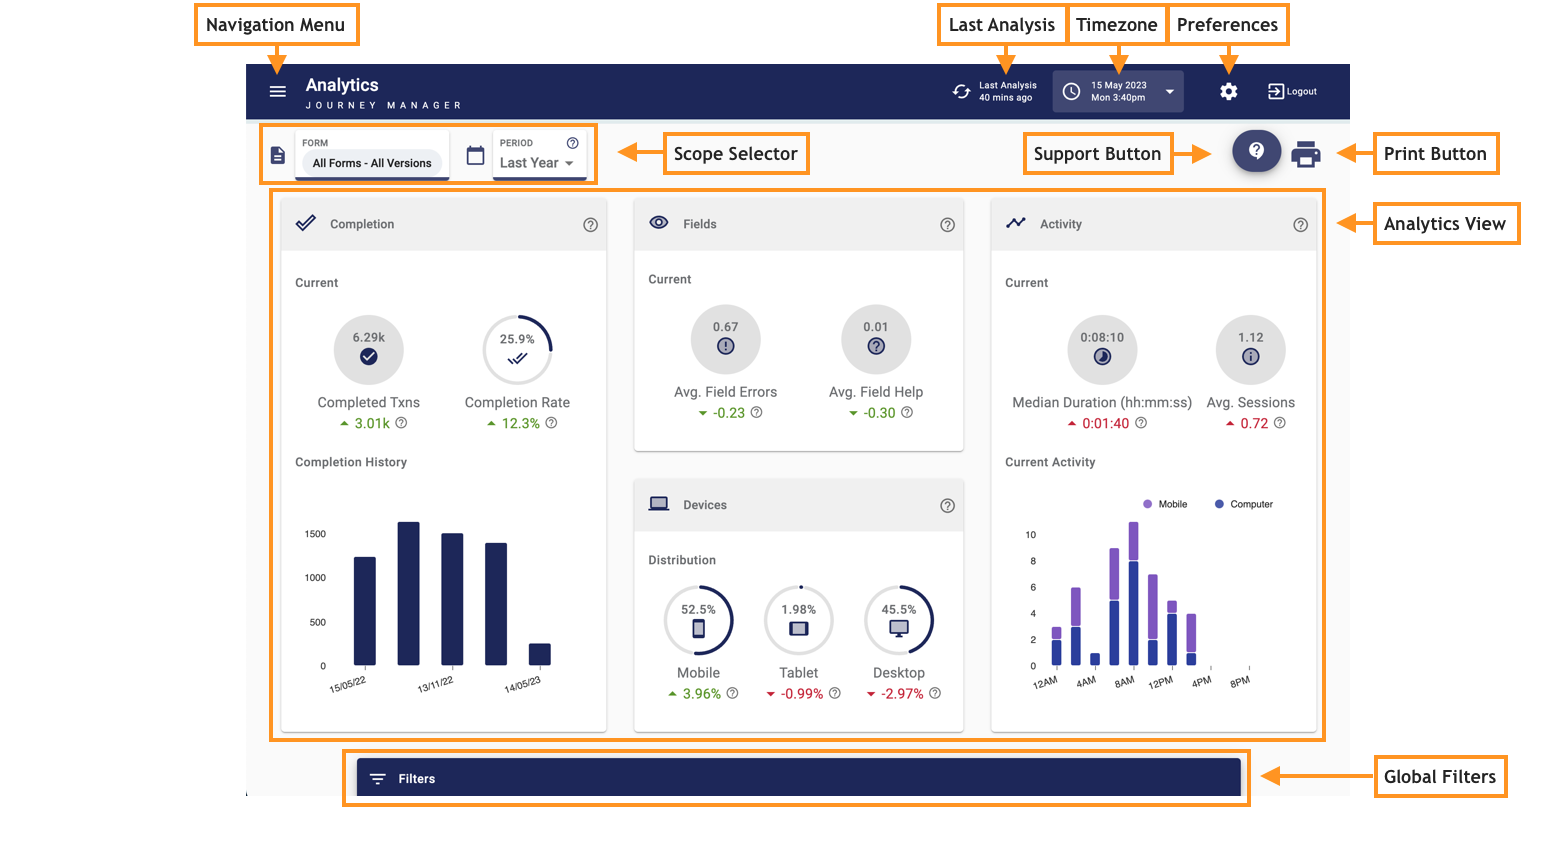
When you have successfully logged into Journey Analytics, the user interface is displayed. User interface components are:
- Navigation Panel
- Scope Selector
- Last Analysis
- Timezone
- Preferences
- Support button
- Print button
- Analytics View
- Global Filters
Navigation Panel
Use the Navigation Panel to select which analytics view displays.
Scope Selector
Use these two dropdowns to select which forms or applications, and the time period, to analyse in Journey Analytics views. Learn more about the Scope Selector.
Last Analysis
Refer to this indicator to determine the freshness of the current data used in all views. Typically, user behaviour data is updated hourly for all views. Learn more about the Last Analysis indicator.
Timezone
Use this dropdown to select the timezone from which to view transactions. Typically, users should set this to their current timezone or the timezone where applicants are located. Learn more about the Timezone.
Preferences
Journey Analytics Administrators can use these options to configure Segment Whitelist entries so that the data can be captured in applicant transactions. Learn more about Preferences.
Support button
Use this button to get documentation about a particular analytics view or to suggest an enhancement.
Print button
Use this button to get a printer-friendly output of Journey Analytics views which can be saved to PDF or as a hard copy. Learn about Print Support.
Analytics Views
The Analytics view is the main section of the user interface, and by default, the Dashboard View will display. Each view leverages different charts and metrics for a particular type of analysis. All views are visible on the Navigation Panel and include:
Global Filters
Use these options to apply whitelist or blacklist filters to limit which types of transactions are in scope for analysis. Learn more about Global Filters.