Field Analysis View
Journey Analytics The behavioural analytics tool. | Analytics User | Latest Version Latest version 23.04.0 cloud hosted.
The Journey Analytics Field Analysis View displays detailed field-level statistics for a selected section (or All Sections) for all transactions within the selected scope. Use this view to identify abandonment hotspots, optimization opportunities and to understand how users interact with fields within the selected sections.
To use the Field Analysis View:
- Navigate to Field Analysis View by one of two ways:
- Select Field Analysis from the Navigation Panel.
- From Dropoff View, click any section column on the Section Completion Chart to display the section's Field Analysis.
- If not already set, select the application and time period to analyze.
- The Field Analysis View displays.
- Use options to filter the data to display.
Only one version of an application can be selected at a time in the Field Analysis View.
Components of the Field Analysis View
The Field Analysis View contains the following components:
- Field Analysis View options
- Section-Level Metrics
- Field-Level Metrics
Field Analysis View options
These options are used to change how and what data is displayed for both Section-Level and Field-Level Metrics.
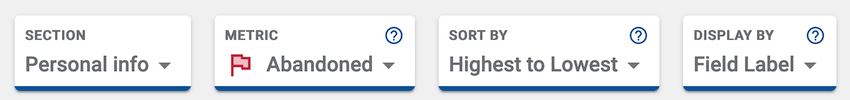
Use Section to select a section, or All Sections, to analyze all fields in all sections of the application.
Use Metric to select different statuses of the applications to analyze, such as Keystrokes, Abandoned or Completed.
Use Sort by to sort by either:
- Natural Sequence - the order in which the fields appear in the application.
- Lowest to Highest - based on the selected metric and its score.
- Highest to Lowest - based on the selected metric and its score.
Use Display by to display the data by field label or field path.
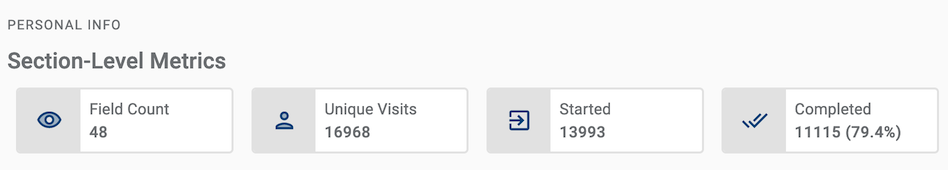
Section-Level Metrics
These stats provide summary info for the sections selected and associated user transactions.
| Statistic | Description |
|---|---|
| Field Count | The number of fields (that had user interactions) within the selected section |
| Unique Visits | The total number of transactions where users navigated to the selected section. The metric includes all transactions whether the user actually Started the section or immediately Bounced after navigation. |
| Started | Section-level Started count is the volume of transactions where the user interacted with fields in the selected sections. |
| Completed | Section-level Completion shows the volume and rate of user transactions which interacted with and completed the selected section. This option is not displayed for 'All Sections'. |
Field-Level Metrics
These stats are at the field-level and can help you identify fields where users spend more effort to complete. Effort can be better understood by factoring in many stats like Keystrokes used, number of times Help info is viewed, Errors encountered, and looking to fields with higher rates of Abandonment.
For each field within the selected sections where user interactions occurred, the following stats are displayed:

To better understand each stat, use the table for reference:
| Statistic | Description |
|---|---|
|
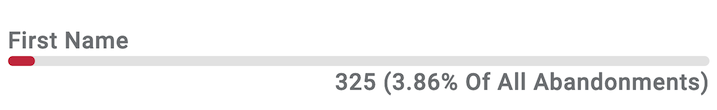
Field-level Rate for Selected Metric - The field name (or path) and the rate for the selected metric is displayed. |
|
|
Completion rate - The rate at which users complete the field, expressed as a percentage of the total number of field commencements. Field commencements are recorded only if the field is interacted with or touched by a user. |
|
|
Average Field Errors - The average number of times a field error occurs within a single transaction, includes validation and mandatory errors. Only the form transactions where users interact with the field are factored in. |
|
|
Median Time Spent - The median length of time that users took to complete the field after first interacting with the field. |
|
|
Average Field Help - Average number of times the field help was used per form transaction. |
|
|
Median Keystrokes - The median number of keystrokes used to complete the field per form transaction. |
Examples
Since various options exist for leveraging the Field Analysis View, please refer to these example analyses below to better understand the potential insights this view can provide.
Field Analysis Example - Keystrokes
From the Metric dropdown, choose Keystrokes to view a detailed keystroke analysis of each field in the section selected.
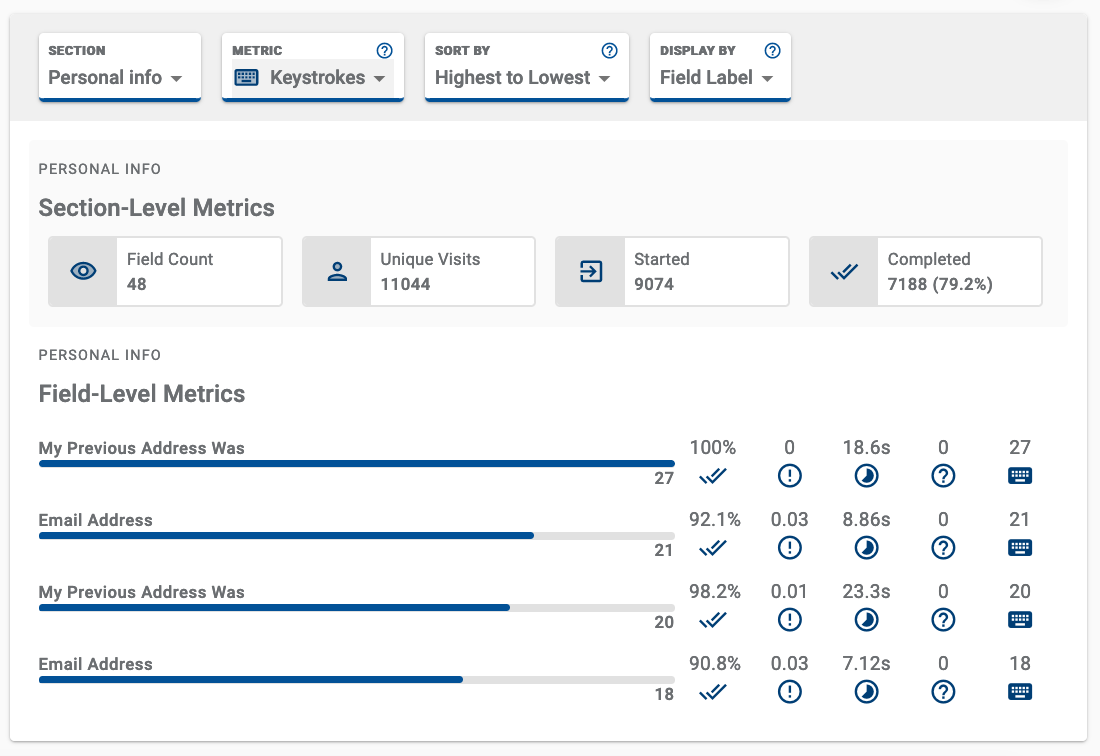
Note that for some fields, keystroke values may be zero, for example:
- A field will result in zero keystrokes if the user uses a radio button or dropdown, as no keystrokes are recorded for this type of field.
- A field that uses an auto-fill function will have no keystrokes associated, as the user is not required to enter anything into the field.
Field Analysis Example - Abandoned
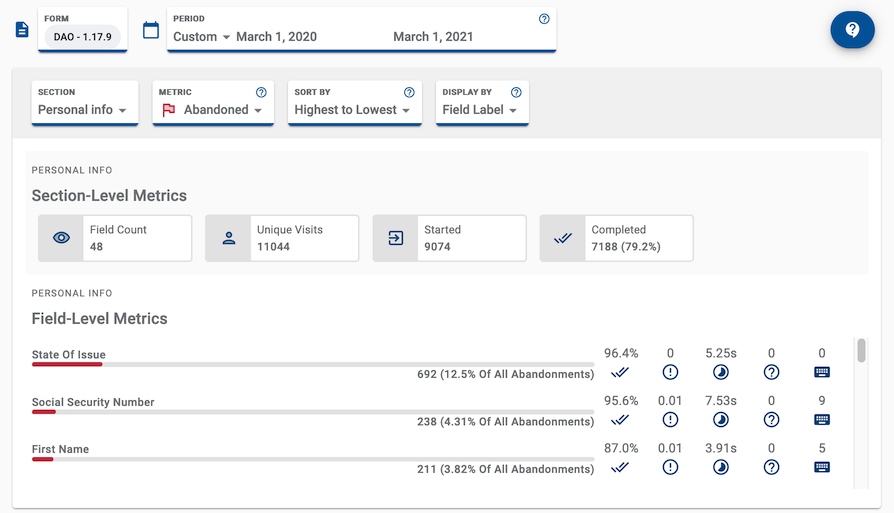
From the Metric dropdown, choose Abandoned to take a look at field-level abandonment for each field in the section selected.
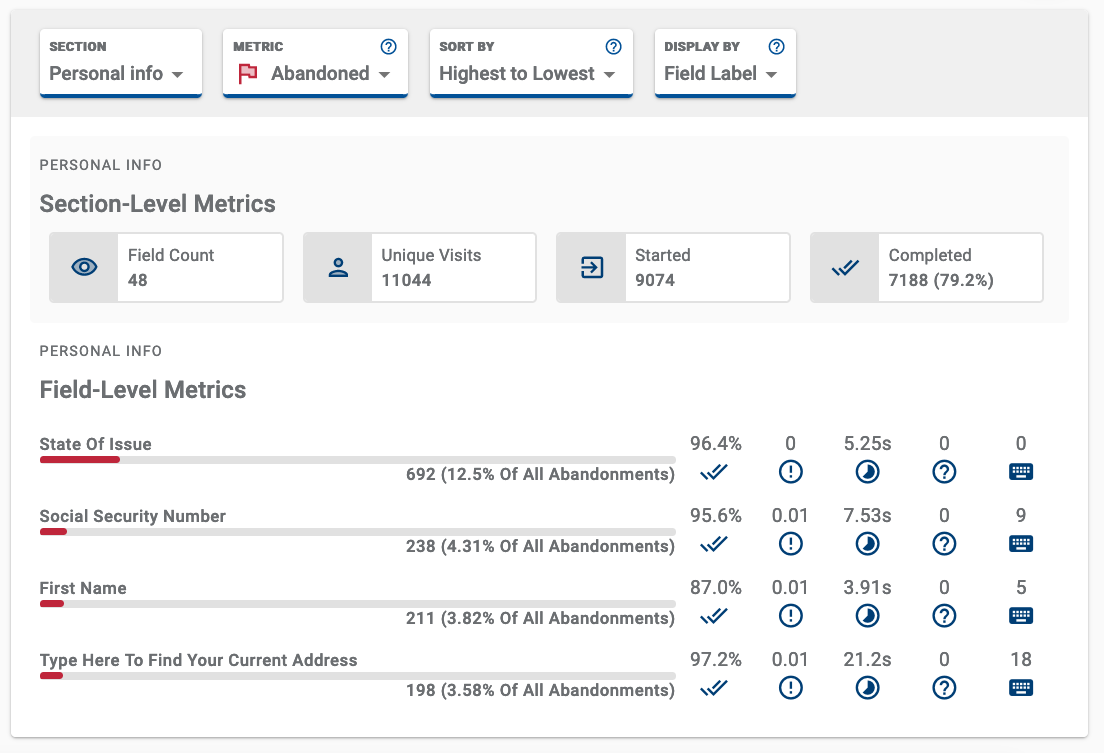
For each field, the field-level rate indicates the number of transactions where the field was the last to receive user interaction before the transaction was abandoned. In addition to the raw transaction counts, the ratio of total abandoned transactions is also displayed. It's important to examine the actual form design as the culprit field may be a field immediately before or even after the field associated with high abandonment.
Refer to the screenshot example and note the high rate of abandonment for State of Issue field. It may be the case that users face friction with State of Issue Field itself or that users look to the field immediately after State of Issue field, and decide not to proceed with the transaction. Because the last field interacted with in the section was the State of Issue field, its marked as an area of high abandonment.
Field Analysis Example - Completion
From the Metric dropdown, choose Completions to view a detailed analysis regarding which fields in the selected section are completed successfully.
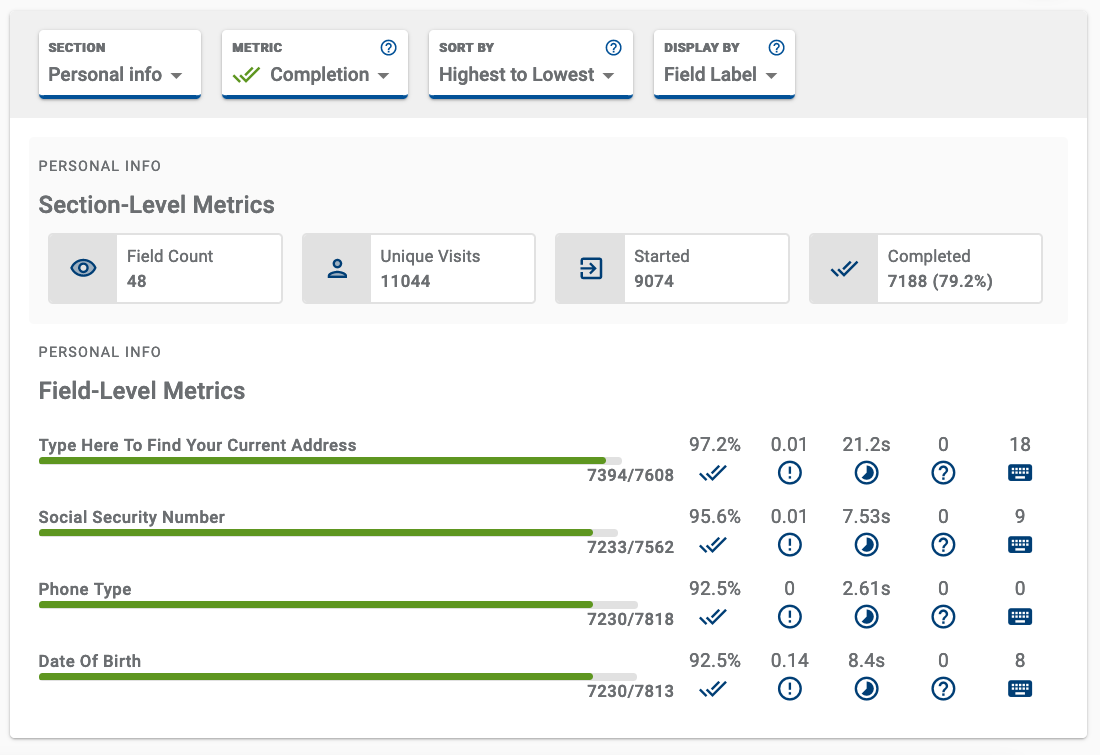
For each field, the field-level rate indicates the number of transactions where the field was interacted with and completed vs. the number of transaction where this field was attempted. These are the raw figures used to calculate the Completion Rate for each field.
Next
Next, learn about Export View.