Dropoff View
Journey Analytics The behavioural analytics tool. | Analytics User | Latest Version Latest version 23.04.0 cloud hosted.
The Journey Analytics Dropoff View provides visualizations to help identify abandonment hotspots by aggregating behavioral data from applicant transactions. Dropoff, or user abandonment, and other user behavior can be examined at the transaction-level for a particular form version and at the section-level to compare each section's performance within a form version.
To display the Dropoff View:
- Select Dropoff from the Feature Navigation Panel.
- Select the application and time period to analyze.
- The Dropoff View displays.
Only one version of an application can be selected at a time in the Dropoff View.
The Dropoff View presents user abandonment data in three separate components:
- Transaction Metrics - displays stats that highlight transaction-level behavior for the application.
- Section Completion - visualizes stats for each section of the application in chart format. The green trend-line that traverses each section represents the slope of transaction completion across the overall journey.
- Section Completion Stats - displays the same Section Completion stats in table format.
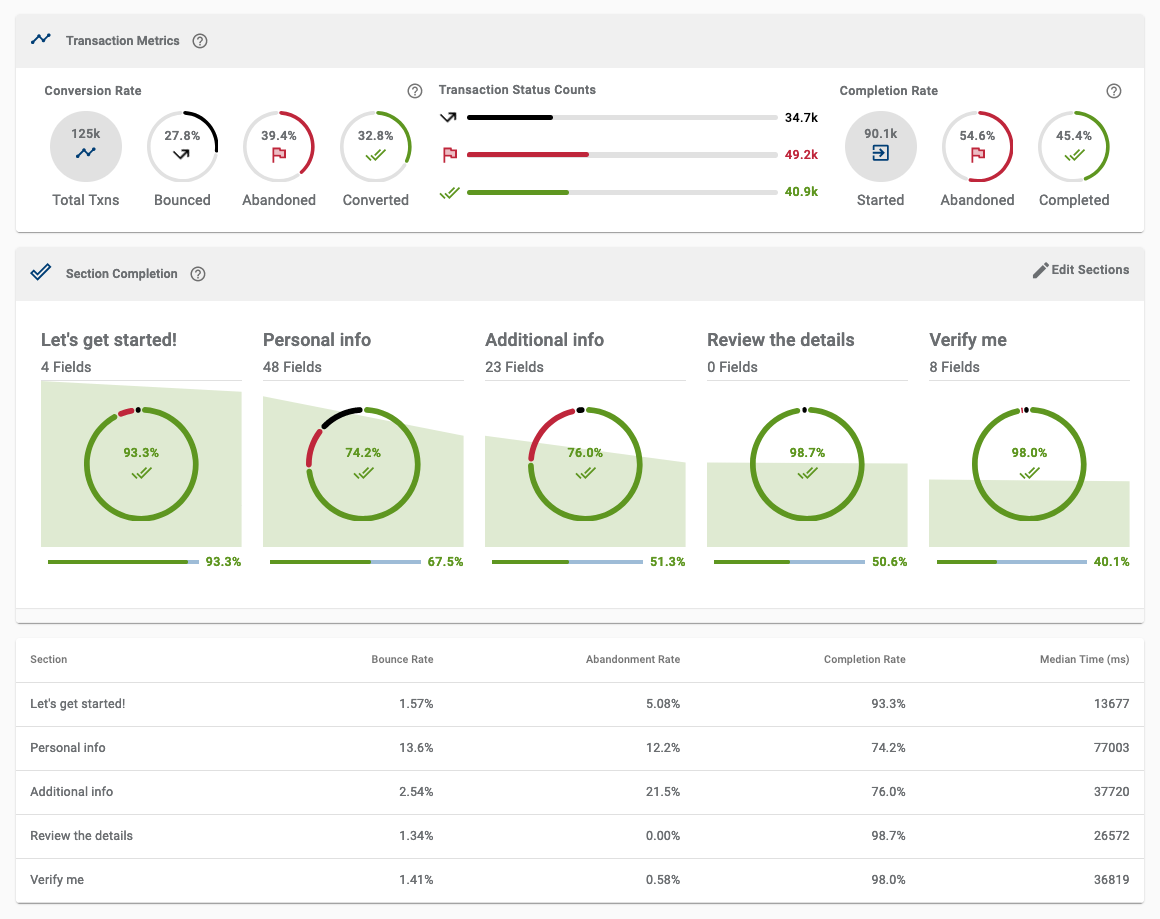
Transaction Metrics
Transaction Metrics visualizes transaction-level data, as opposed to section-level data which is displayed within Section Completion. For this reason, stats will differ between Transaction Metrics and Section Completion.
The Transaction Metrics component contains three sub-components which contain grouped statistics:
All traffic stats will likely include noise which is not actual user traffic, such as from bots and search-indexing requests to the application. To mitigate noise, use Global Filters to either Whitelist specific trusted browsers or Blacklist browsers identified as Robot / Crawler types.
Conversion Rate
![]()
| Description | |
|---|---|
|
Total Txns |
All transactions that were first opened during the selected period, and have a current Transaction Status of either Bounced, Abandoned or Completed. This number excludes transactions that are currently in either Open or User-Saved Transaction Status. |
|
Bounce Rate |
The percentage of Bounced transactions compared to the number of total transactions. |
|
Abandoned |
The percentage of Abandoned transactions compared to the number of total transactions. |
|
Conversion |
The percentage of Completed transactions compared to the number of total transactions. |
Transaction Status Counts
![]()
| Description | |
|---|---|
|
Bounced |
Total number of Bounced transactions during the selected time period. |
|
Abandoned |
Total number of Abandoned transactions during the selected time period. |
|
Completed |
Total number of Completed transactions during the selected time period. |
Completion Rate
![]()
| Description | |
|---|---|
|
Started |
All transactions that were first opened during the selected time period, have had user interaction and are considered either Abandoned or Completed. This number excludes Bounced transactions and transactions that are currently in either Open or User-Saved status. |
|
Abandoned |
The percentage of Abandoned transactions compared to the number of Started transactions. |
|
Completed |
The percentage of Completed transactions compared to the number of Started transactions. |
Transaction volumes may differ between form transaction-level and section-level stats. This discrepancy is due to some users employing browser addons which block analytics event capture.
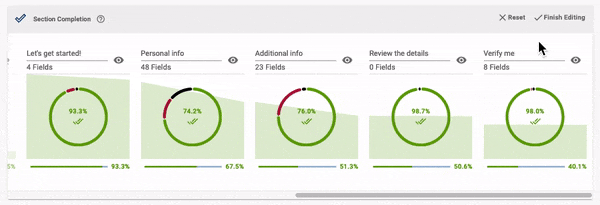
Section Completion
This area of the Dropoff View presents data for each section of the selected application in a detailed chart.
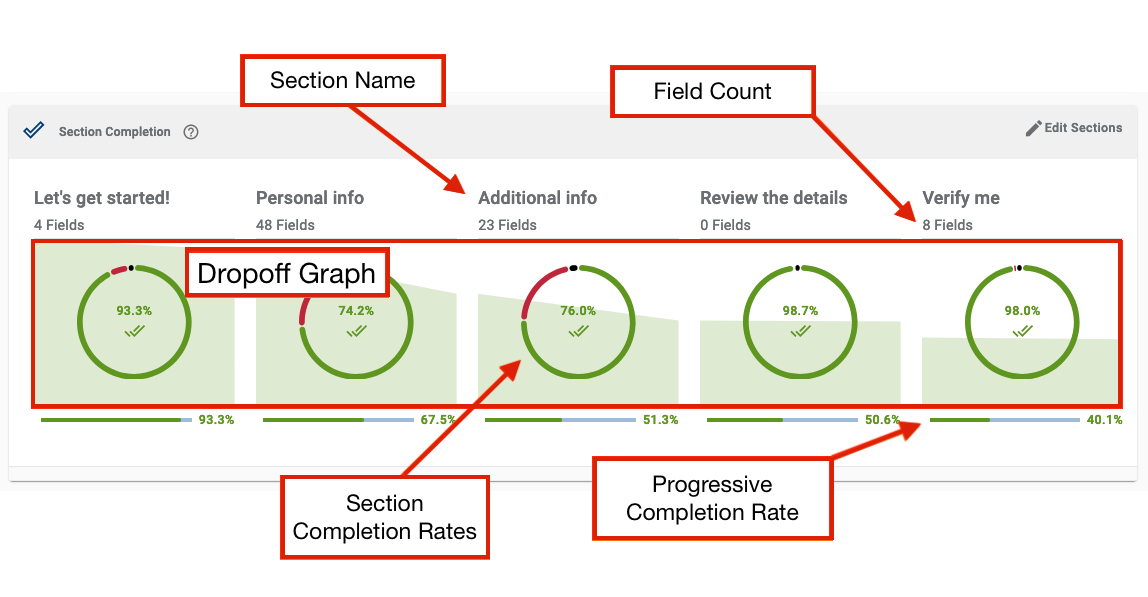
To better understand each part of the Section Completion, use the information below for each chart component:
Section Name

The name of the section. Depending on implementation, this can represent the pages, sections, modals or dialogues of the applications.
By default, both modal and dialogue type sections are hidden. Use Edit Sections to toggle their visibility.
Field Count

The number of fields that users interacted with in each section displays below the name of the section.
The total field count in the form can be calculated by adding up field counts from each section.
Dropoff Graph
The starting height of the green line on the Dropoff Graph represents the the number of transactions where users navigated to the section. Then endpoint of the line for each section shows how many Completed the section.
Clicking an individual section will drill down to the field-level statistics of the section clicked. This is a shortcut that's equivalent to navigating to the Field Analysis View and selecting the same section manually.
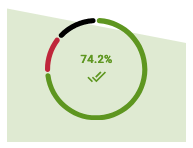
Section Completion Rates
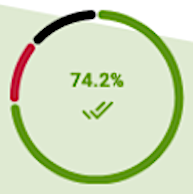
The Section Completion Rates doughnut chart displays the Bounce, Abandonment and Completion rates for each section.
The green rate for completion of the section is displayed by default. Hover over the colored wedges of the doughnut chart to show the corresponding metric at the center of the doughnut.
Hover over the rate in the center of the doughnut to see a more detail and a breakdown of the rates.
| Color | Description | |
|---|---|---|
|
Bounce |
Grey/black |
A user visited the page or section but did not interact with any fields in that section and Abandoned the transaction. |
|
Abandonment |
Red |
A user visited the page or section, interacted with at least one field and then Abandoned the transaction. |
|
Completed |
Green |
A user visited the page or section, filled in all mandatory fields, Completed that section and then proceeded to the following section. |
Progressive Completion
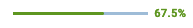
The Progressive Completion Rate metric is shown at the bottom of each section.
This metric shows the percentage of users who completed that section compared to the number of users who Started the application.
Customize the Chart
Click the Edit Sections button to customize how the graph is displayed. In customization mode, you can toggle visibility, reorder, rename and combine sections in the graph.
Any customizations applied are saved to your browser local storage so that you can quickly view the relevant sections on subsequent login. Reset will erase any saved customization and return the Section Completion Chart to the default names, order and visibility of the sections.
Section Completion Stats
The Section Completion Stats presents the same information as the chart, but in a table format. Each row represents each section in the selected application.
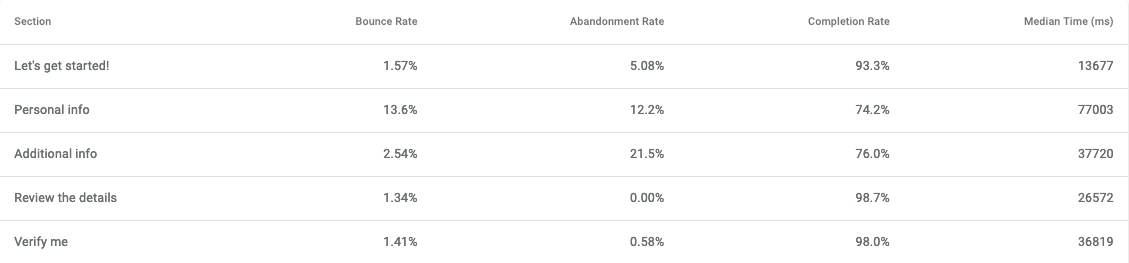
A Section in Journey Analytics is equivalent to a Maestro Page or if using Transact Composer, a Section Level 1.
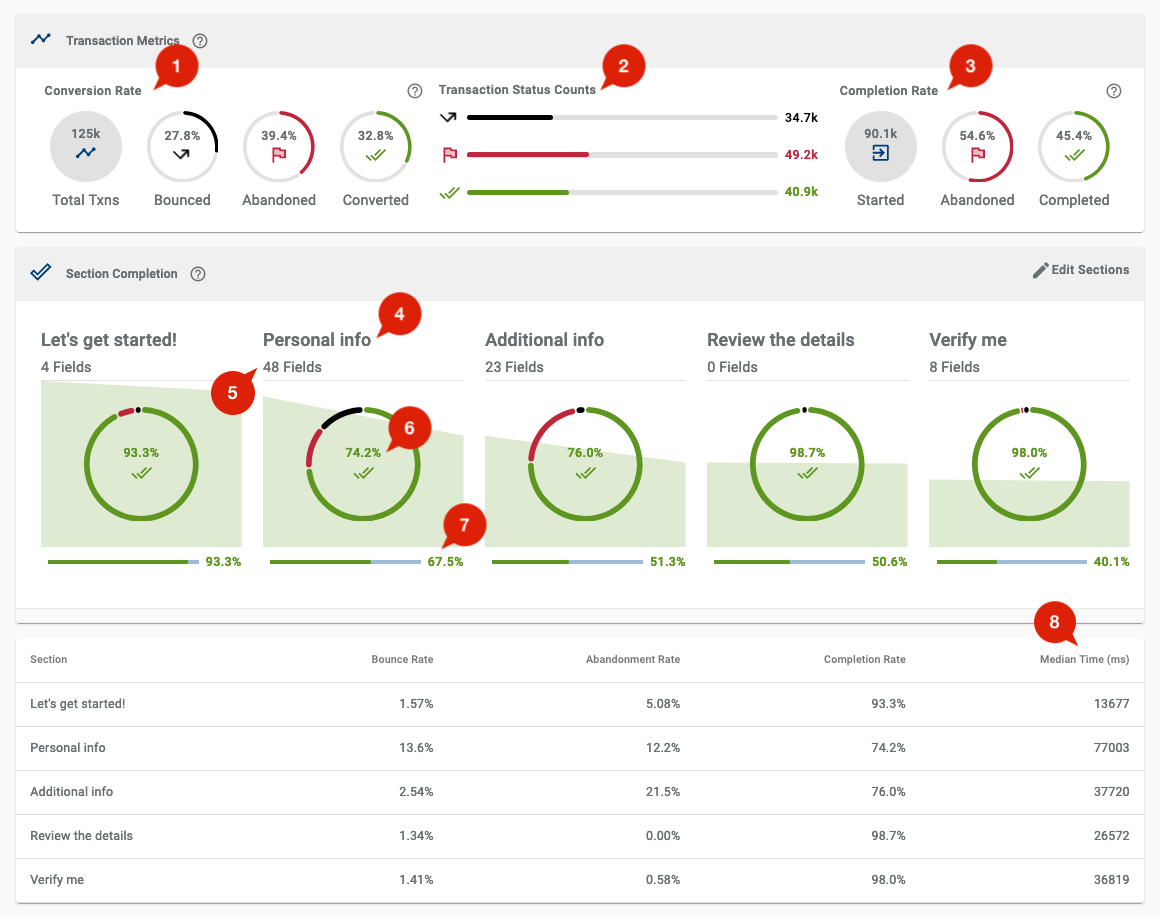
Example Analysis
To better understand real-life usage of the information presented in the Dropoff View, use the example screenshot and the key takeaways below.
| Key takeaways | |
|---|---|

|
There were 125,000 transactions (rounded to the nearest 1000) where a user opened or navigated to the form, as noted by the Total Txns metric. |

|
This shows the actual transaction counts (rounded to the nearest 1000) for each transaction status within the currently selected scope: |

|
This shows only the form transactions where users actually interacted with fields, or Started the form, within the currently selected scope: |

|
This indicates the Personal Info section of the form. |

|
This indicates the field count of the Personal Info section. 48 unique fields received user interactions. |

|
This indicates that, out of the total transactions where users navigated to the Personal Info section, 74.2% were able to complete the required fields for the section. However, the next section, Additional Info, has the highest rate of abandonment for any section in the form, indicating its a point of user friction or difficulty. |

|
This indicates that the section has a 67.5% Progressive Completion Rate, which is the rate of transactions where users made it this far, by interacting with and completing this section, in comparison to the number of Started transactions. In applications where users progress in a linear fashion through the sections, like this example, this rate decreases for the later sections as some users did not progress. |

|
This column indicates the median time that users spend interacting with each section. For the Personal Info section, the median time to complete is 77 seconds (77003 milliseconds), the most time-consuming section for users within the currently selected scope. |
Next Steps...
When you've identified a section where users 'dropoff', click the section in the Section Completion chart to drill down and analyse user behavior for fields within the section using Field Analysis View.