Using the User Journey View
Journey Analytics The behavioural analytics tool. | Analytics User | Latest Version Latest version 23.04.0 cloud hosted.
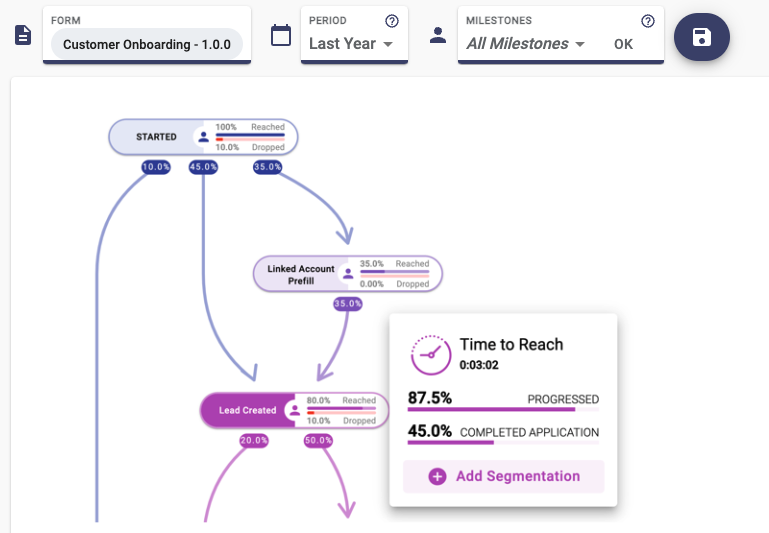
To access the User Journey View of Journey Analytics:
- Select User Journeys from the Navigation Panel.
- Select the application and time period to analyze.
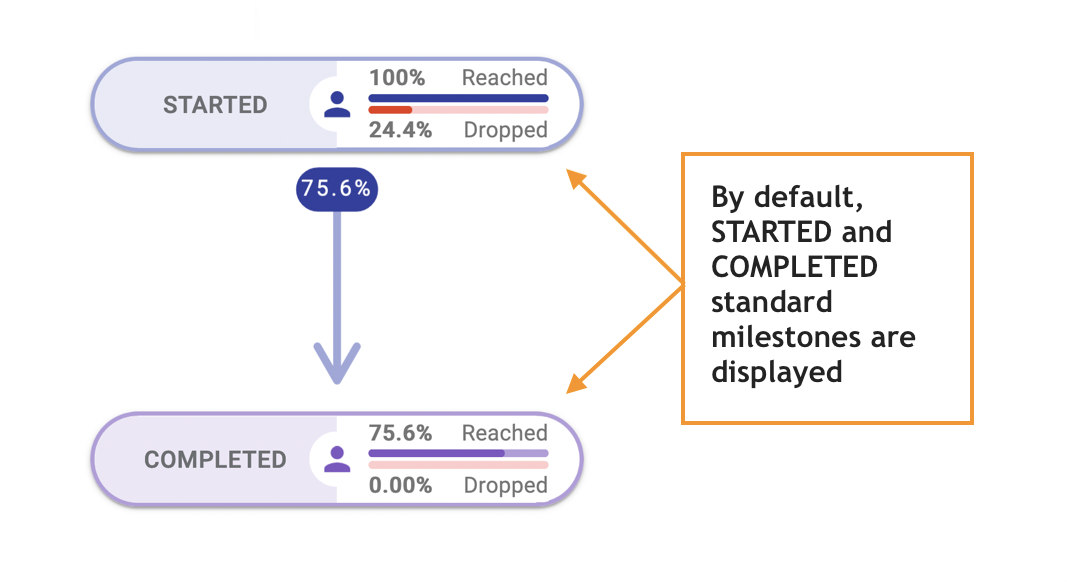
- The User Journey View displays with just the Start and Finish milestones.
- Select the pre-configured custom milestones in the application from the Milestones dropdown menu.
- Click Apply or OK to add those milestones to the User Journey View.
- The User Journey View now shows the custom milestones in the application.
To monitor changes to User Journeys over time, it is recommended to use form versioning in Maestro to isolate particular versions of a form, and to carefully select the timeframes the specific form versions were in use, to use as a comparison.
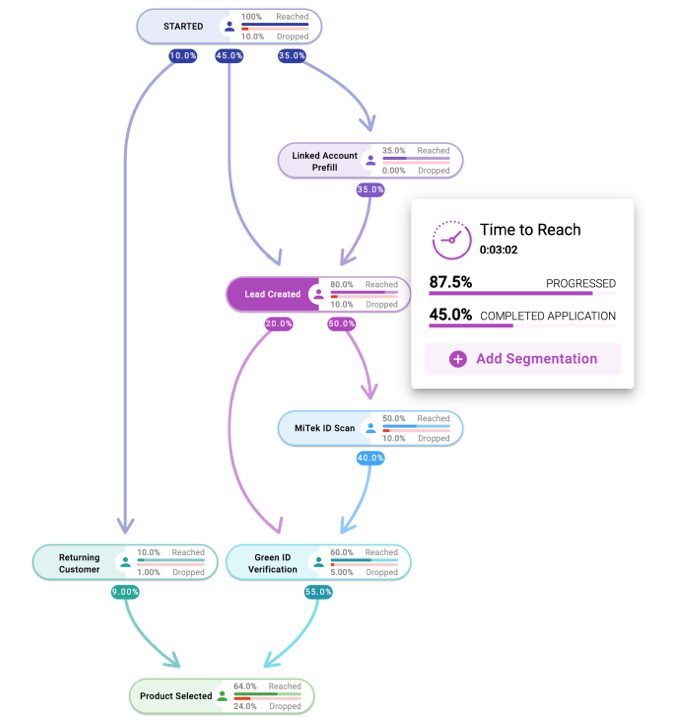
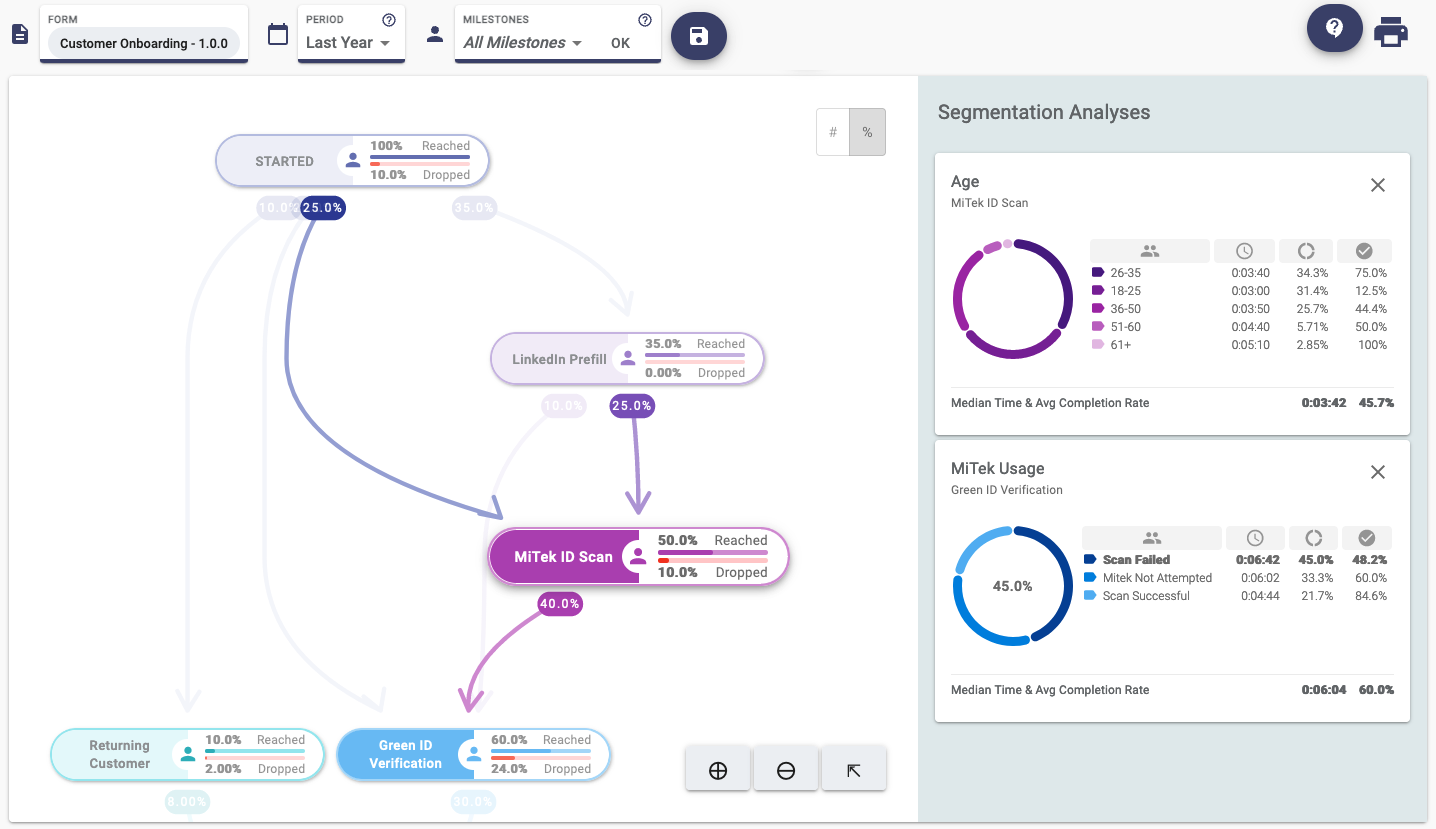
In this example, LinkedIn Prefill, MiTek ID Scan, Green ID Verification and Returning Customer custom milestones were selected and now appear in the User Journey View.
By adding the custom milestones it is now possible to see how users are progressing through the different paths towards the eventual completion of the application.
The percentage on the User Journey path represents the number of users that took that path to the next milestone. Hover over the individual milestones and paths to highlight them.
Additional milestone metrics
To understand the impact of a milestone on application completion rates, click on the milestone to display more useful metrics.
Additional metrics:
- Median time for users to reach the milestone from the start of the application.
- Percentage of users, who reached this milestone, who then progressed onto other milestones in the application.
- Percentage of users, who reached this milestone, who eventually completed the application.
On the popup, use the Add Segmentation link to segment the users who reached this milestone by adding a segmentation chart.
To move around a large User Journey View with multiple milestones, hover over the milestones and user journey paths to highlight them, and scroll to zoom in and out. To move the User Journey View around the screen, click and drag the diagram.
Add Segmentation Charts
If you have broken up your users into segments or groups by sending custom segment events from a supported application, you can also perform segmentation analysis in this view.
Segmentation analysis is a powerful tool that helps understand the behavior of a group of users who share common characteristics. You can identify what group of users abandon the application and at what stage of the journey and understand key metrics for each group of users that have reached a specific milestone. Using this feature, you can slice and dice the data to improve the granularity of the analysis.
To add a segmentation chart for a milestone, click on the Add Segmentation link on the milestone, select the pre-configured segment name from the dropdown, and then click Apply.
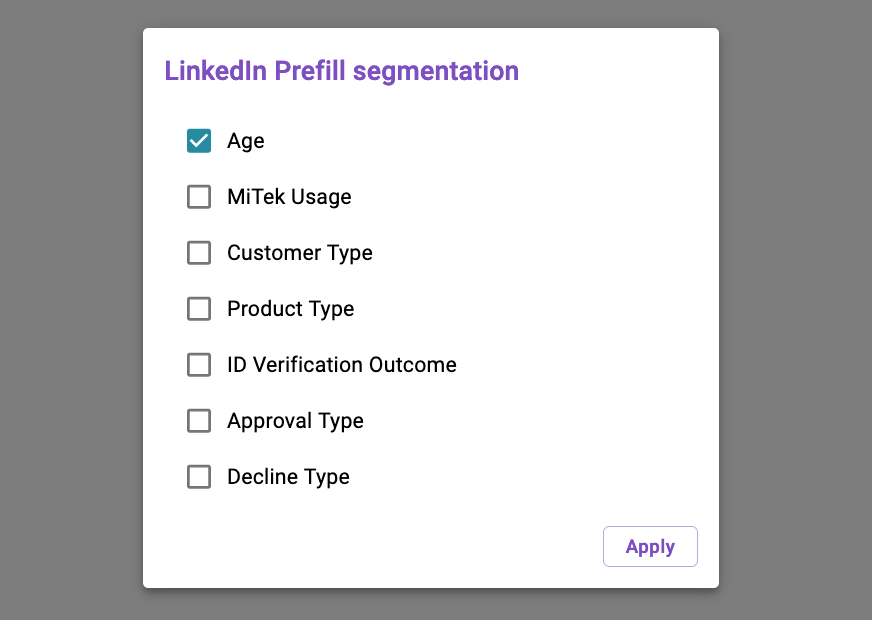
The segmentation chart for that milestone will display at the bottom of the screen. In this example, the Age segmentation chart was added to the LinkedIn Prefill milestone.
Metrics in segmentation charts
| Metrics | Icon | Description |
|---|---|---|
|
Segment |
|
The Segment column displays the segment values sent via Segment APIs from a supported application. |
|
Time |
|
The Time to reach milestone column displays the time it took each group of users (segments) to reach this milestone from the start of the application. Use this metric to identify any bottlenecks in the user journey. Legend: d=days h=hours m=minutes s=seconds. |
|
Application completion rate |
|
The Application completion rate column displays the percentage of each group of users (segments) who eventually completed the application. Use this metric to determine which group of users (segment) has a better probability of eventually completing the application. There may be a reason why a certain age bracket of users took another path through the application, such as young or mature users do not have a LinkedIn profile, or existing customers find it easier to navigate through an application if their account details are pre-populated during the application process. In the above example 75% of the users in the 26-35 age bracket went on to complete the application, 44.4% of the 36-50 age bracket went on to complete the application, and 100% of the 61+ age bracket went on to the complete the application. |
|
Median Time |
The Median time metric is the middle value of all segment time values displayed for this milestone. |
|
|
Avg Completion Rate |
The Average completion rate metric averages the completion rates for all segments displayed for this milestone. |


Any number of segmentation charts can be added, on any milestone, as long as they have been pre-configured. It is recommended to show the same segmentation chart for each milestone in the User Journey View to identify how the different users respond at different points throughout the user journey.
Video
Watch the video for more information on how to read the metrics in this view.
Next
Next, learn How to Send Custom Milestones and Segments.