Groovy Service Log
Journey Manager (JM)
The transaction engine for the platform. |
Form Builder  Platform Developer | 17.10
This feature was introduced in 17.10.
Platform Developer | 17.10
This feature was introduced in 17.10.
Manager allows you to view messages generated and logged by functions and services written in Groovy, so you can debug and profile them. When a form calls a Transact function, it executes a Groovy script, which can be programmed to write some information into a log file by using a Logger class, for example, logger.debug("Variable: " + varaibleValue). In this case, this message is logged into Groovy Service Log and can be viewed in the Groovy Service Log tab.
Do not use Groovy Service Log for any other purposes but troubleshooting of Groovy services.
Do not use Groovy Service Log for auditing and reporting.
Messages logged to the Groovy Service Log are stored in the GroovyServiceLog table, which can grow big, so you need to set up data purging according to your requirements.
All log messages associated with a transaction or PIIPersonally Identifiable Information (PII) is information about an individual that can be used to distinguish or trace an individual‘s identity, such as name, social security number, date and place of birth, mother‘s maiden name, or biometric records; and any other information that is linked to an individual. In Europe, PII is known as personal data. data are encrypted so you can't search for a part of encrypted text. If you want to search encrypted messages, you need to implement different logging solutions, for example, using the System Event Publisher.
The log can be empty if there is no debugging configured or if the debugging is disabled.
Do not log PIIPersonally Identifiable Information (PII) is information about an individual that can be used to distinguish or trace an individual‘s identity, such as name, social security number, date and place of birth, mother‘s maiden name, or biometric records; and any other information that is linked to an individual. In Europe, PII is known as personal data. data to the service log, for example, to debug a service, as there's a risk of exposing customer's details through the log file.
To view all Groovy service log messages, select Services > Groovy Service Log.
Messages are shown page by page, with the maximum number of records per page configured via the user's preferences.
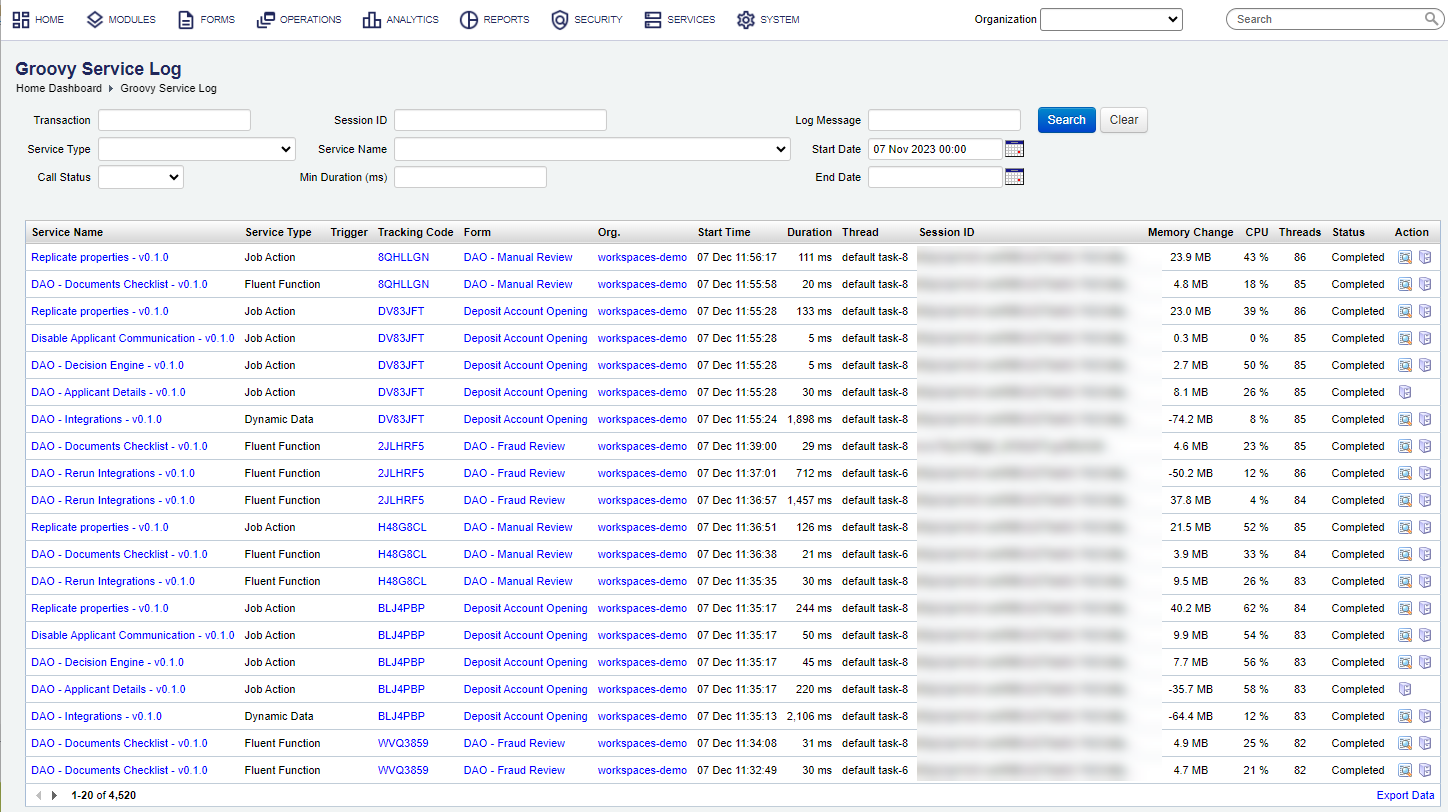
The Groovy Service Log list displays the following details for each log entry:
- Service Name - a service that logged info into the Groovy Service Log. Click the service name to see more details
- Service Type - a type of a service
- Trigger - a trigger of a function
- Tracking Code - a tracking code of a transaction associated with the service invocation. Click a tracking code to see more details
- Form - a name of a form that called the service or the function
- Org - a client code of an organization where this form is hosted
- Start Time - date and time when the service or the function was invoked
- Duration - how long the service or the function ran, in milliseconds
- Thread - a name of a Java thread in which this service was executed
- Session ID - a form session ID
- Memory Change - how much memory was allocated for the service of the function invocation
- CPU - the CPU utilization at the service invocation time
- Threads - a number of threads used by a service or a function
- Status - a service invocation status:
- Completed
- Error
To filter or search the Groovy Service Log by one or more criteria, specify the following settings and click Search:
- Transaction
- Session ID
- Log Message, or part of a message text, This searches through unencrypted messages logged by services that are not transaction-related.
Note You can't use this functionality to look for a part of encrypted text.
- Service Type. Select a type of a service from the dropdown list to see all messages logged by services of this type.
- Service Name. Select a service name from the dropdown list to see all messages logged by services of this name.
Note Only services of a selected service type are shown in the dropdown list, if you used the Service Type filter above.
- Call Status. Select a status of the message from the dropdown list, that can be: Completed, Error, or both.
- Min Duration (ms). Select a minimum duration of a service call. This is handy to troubleshoot services and overall server performance by filtering down services that took longer to do work.
- Start Date and End Date of the message.
Click Clear to reset the search criteria.
Click Export Data to export the displayed data as a Microsoft Excel (XLS) file.
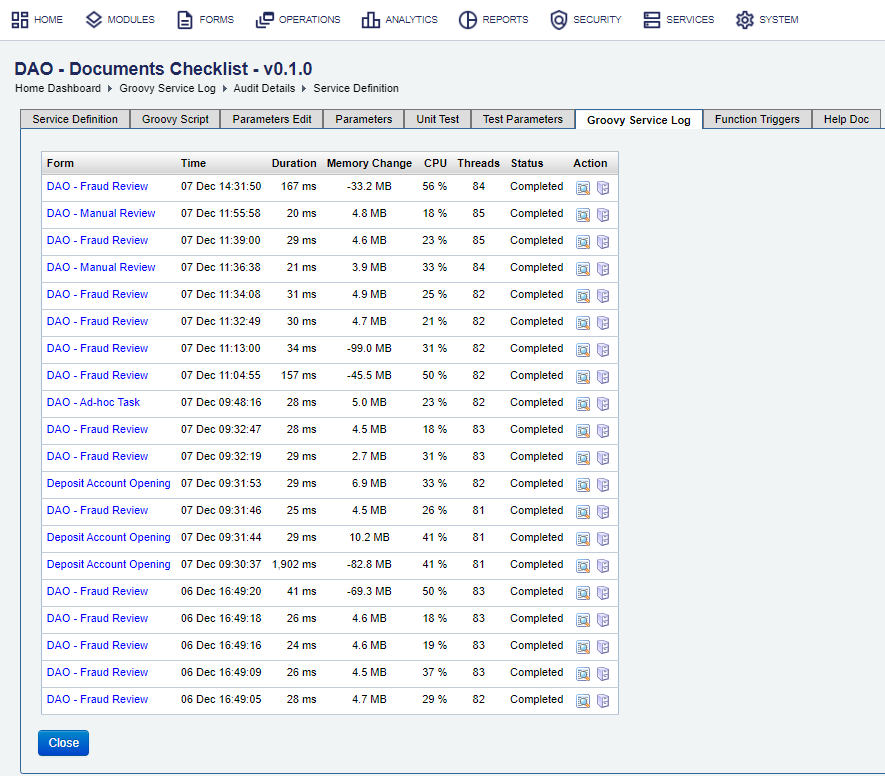
Alternatively, you can view Groovy Service Log directly from a Transact function's or a service's definition.
To view a Transact function's or a service's Groovy service log:
- Select Services > Transact Functions or Services > All Services.
- Locate a Transact function or a service and click Edit.
- Click the Groovy Service Log tab to see the list of forms from where functions were invoked with the following details:
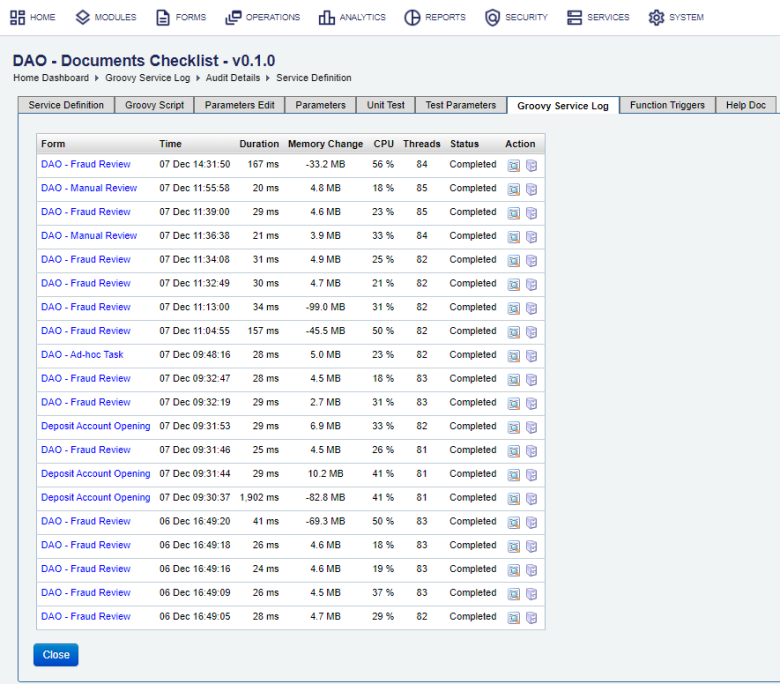
- A form name - a form name that invoked the service or a function. Click the form name to see more details in a form dashboard
- A function invocation time
- Duration of the invocation
- Memory change - how much memory was allocated for a function or service invocation. It shows the delta (difference) in JVM free memory before and after the service invocation. The higher the absolute value is, the bigger memory consumption is.
Note The memory change value can be negative, but it is the delta value what is important for you to analyze.
- CPU - the CPU utilization at the service invocation time
- Number of Java threads used by the function or the service
- Status of the invocation:
- Completed
- Error
- Click Groovy Logger to view the output created during the function invocation.
- Click Submission View to see details of a transaction associated with this function call.
- Click Close.
Select the Groovy Log tab to see the same logged messages.
To enable Groovy logging, select the Groovy Scripting Enabled checkbox in the Parameters Edit tab.
Next, learn how configure Transact function service definition.