Debug Maestro Forms
MaestroThe UI design product. | Form Builder | All versions This feature is related to all versions.
If a Maestro form doesn't behave as expected, it might be related to one of the business rules you've created using the Maestro script editor. It's very important to understand the form architecture before you delve into form debugging, as there are certain assumptions of how the 3 form elements are used in interact within the form.
Tracking down problems in business rules can be tricky, so we've summarized several useful techniques for finding and fixing problems using Chrome DevTools. which are available when you open a form in a Google Chrome browser. Most modern browsers come with good developer tools these days. We prefer to use Google Chrome, but Firefox and Microsoft Edge can also be used.
Maestro forms are built on the AngularJS framework and plugins are available to provide specific support for AngularJS web applications. For example, in Chrome, you can use AngularJS Batarang.
Debugging application forms in the browser is a technical task and requires some understanding of web application development in general, specifically the web standards of HTML, CSS and JavaScript. We recommend getting familiar with HTML, CSS, and JavaScript technologies to be able to debug forms. Also, as Maestro runs on the AngularJS JavaScript framework, AngularJS experience is useful if you'll be debugging on a regular basis, but it is not required. If you want to know more about AngularJS, read the official tutorial.
The debugging process includes the following steps:
- Compare form versions
- Build a form
- Open Chrome DevTools
- Inspect the Form object
- Debug JavaScript Rules
- Set Breakpoints
Compare a Form Version with a Previous Version
Check what changes have been done in a form version you are troubleshooting as some changes can cause unexpected behaviors. You can use the Compare Designs functionality to view the differences between 2 form versions. You should review and understand whether these changes caused any issues and correct them if needed.
Build a Form
Before you can start debugging a Maestro, you need to build it with the Minify Code checkbox unselected, so unnecessary characters, such as white space, new lines, and comments, are not removed.
If the Minify Code is selected, the result of minification is a single line of code that is very long and difficult to read and debug.
After that, you render the form so it's opened in a new Google Chrome browser. If a new browser tab doesn't open, check if your browser is blocking pop-ups and, if so, allow them from the Maestro URL.
Whenever you make a change to the form, you'll need to rebuild it.
Open Chrome DevTools
Chrome DevTools provide access to a range of features for diving into the look and feel, functionality, and performance of web applications. Once the published form is loaded in the browser you can activate the browser's developer tools.
To open Chrome DevTools:
- Select the browser tab that contains the rendered Maestro form.
- Click F12 or Control+Shift+I to open the DevTools pane, as shown below:
For more information, see Google's Chrome DevTools.
Inspect the Form Object
When you load a Maestro form in your browser, a Form object, which contains the data required to render the form, is initialized. In the Maestro framework, the Form object contains everything else you might need to access for debugging including the View, Items and Data, so to access any of these elements you need to scope the Form object. There are a number of ways to do this from the Console tab in the browser developer tools.
To inspect the Form object:
- Selecting the Console tab and executing one of the following queries to retrieve a Form object:
- Using JQuery:
$("Form").scope().Form - Using the Maestro root element included with the framework:
maestro.Form - Using AngularJS Batarang, if installed:
$scope.FormThis may also allow you to access the Form object by way of the
$scopeobject. However, you need to select an element in the Elements tab first, for example, a body or form.
- Using JQuery:
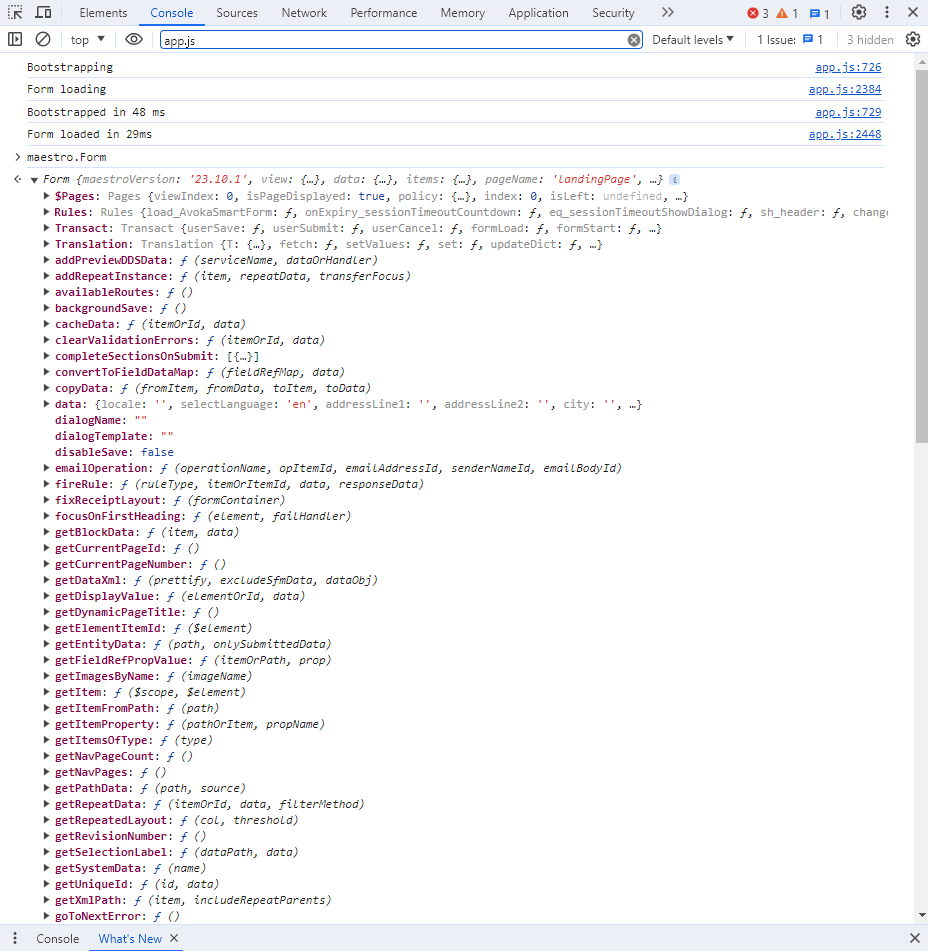
- Expand the Form object to see all elements. Usually, the object is quite large, so you need to know that there are three objects within the Form object that are worth exploring:
data,items, andview. For more information, see Maestro Form Architecture. - Check these 3 main objects. If you have a JavaScript debugging session active, as described below, you will have access to the Form Data object in the function scope and can readily inspect its content.
Debug JavaScript Rules
All business rules in Maestro are implemented in JavaScript. As a result, a straightforward way to debug these rules is by using console.log statements in the script editor: console.log("Hello world...");.
To distinguish between different types of output, you can also use the console.warn("This message will have a yellow background"); and console.error("This message will have a red background"); methods:
Below are some useful snippets for outputting relevant data inside a business rule:
// Inside a business rule, "value" refers to the data attached to the current field:
console.log(value);

// The "data" object, explained above, can be output from inside a business rule:
console.log(data)

// You can access any field value via the data object by referring to its ID:
console.log(data.lastName)

// The "item" object, explained above, can be output from inside a business rule:
console.log(item)

// Some components, such as the Page Controller component, output extra information via the "info" object:
console.log(info)
You can run various commands in the console to print form's data. For example, you can use console.log(maestro.Form.getDataXml(true)) to list the /SFMData/SystemProfile content as an XML file, as shown below:
<AvokaSmartForm>
	<AboutYou>
		<FirstName>
		</FirstName>
	</AboutYou>
	<SFMData>
		<SystemProfile>
		    <FormCode>Test 1</FormCode>
			<RequestLogKey>12345</RequestLogKey>
			<DisplayMode>Entry</DisplayMode>
			<ServerBuildNumber>22.4.0</ServerBuildNumber>
			<RevisionNumber>0</RevisionNumber>
			<FormDataServiceURL>https:/[/YOUR-SERVER-HOST-NAME]/web-plugin/servlet/FormDynamicDataServlet</FormDataServiceURL>
			<TrackingCode>ABCD1234</TrackingCode>
			<AbandonmentReason>
			</AbandonmentReason>
			<AbandonmentComments>
			</AbandonmentComments>
		</SystemProfile>
	</SFMData>
</AvokaSmartForm>
There is a handy Util function to generate a printable representation of an item and then log it to the console: $scope.Util.logItem($scope.Form.items.personalDetailsBlock). The output is shown below:
"personalDetailsBlock
┌ firstName
└ middleNames
─ lastName
─ dateOfBirth
 ┌ day
 │ month
 └ year
 ─ date
 ─ daysData
─ emailAddress
─ mobileNumber
"
While console.log statements are easy to use, you'll need to rebuild and reload the form every time you make a change. This makes it a fairly slow method of debugging. For more productive debugging, we recommend using breakpoints.
Set Breakpoints
Breakpoints allow you to define places in your JavaScript where the script execution must pause, so you can investigate where exactly your code breaks without having to write a bunch of console.log statements or continually rebuild and refresh the form.
All JavaScript code used by form's business rules are stored in the app.js file, so you must locate this file and set breakpoints there.
To set breakpoints:
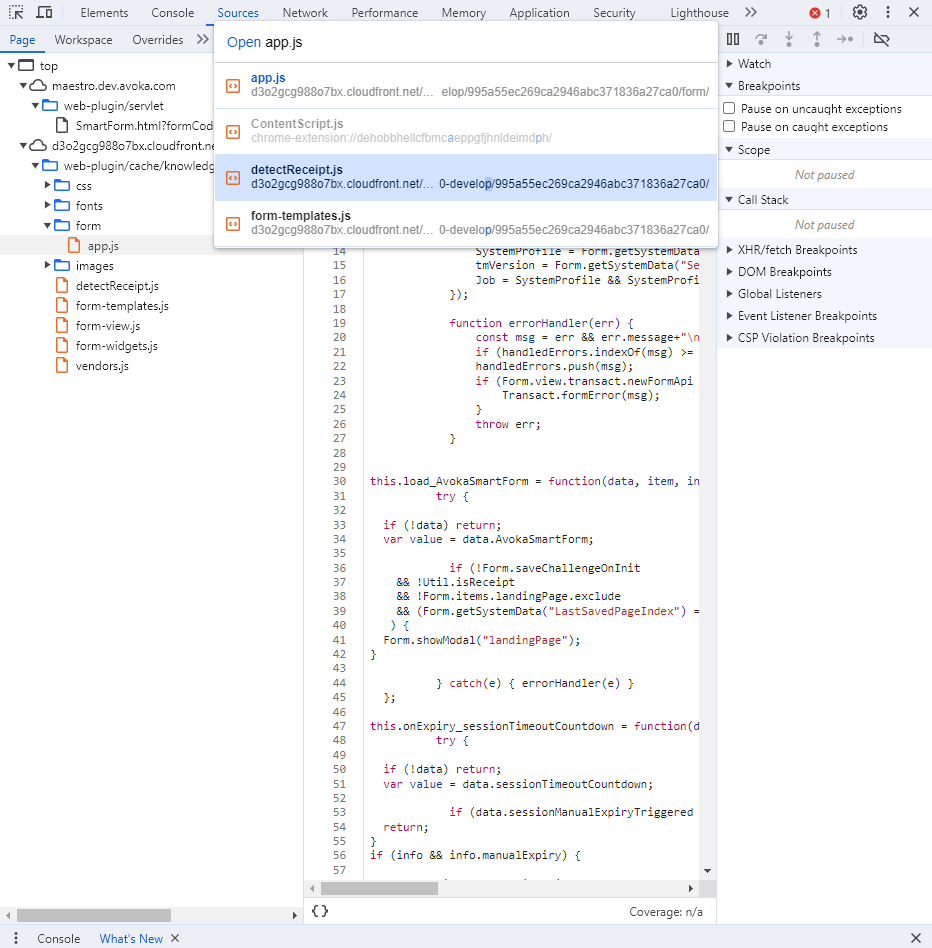
- Select the Sources tab in Chrome DevTools.
- Click Control+O (Command+O on a Mac) and type
app.jsto find all references to theapp.jsfile. Alternatively, navigate through the Page hierarchy on the left until you see theapp.jsfile.
- Select the
app.jsand click it. - Click Control+F on Windows or Command+F on Mac to find the
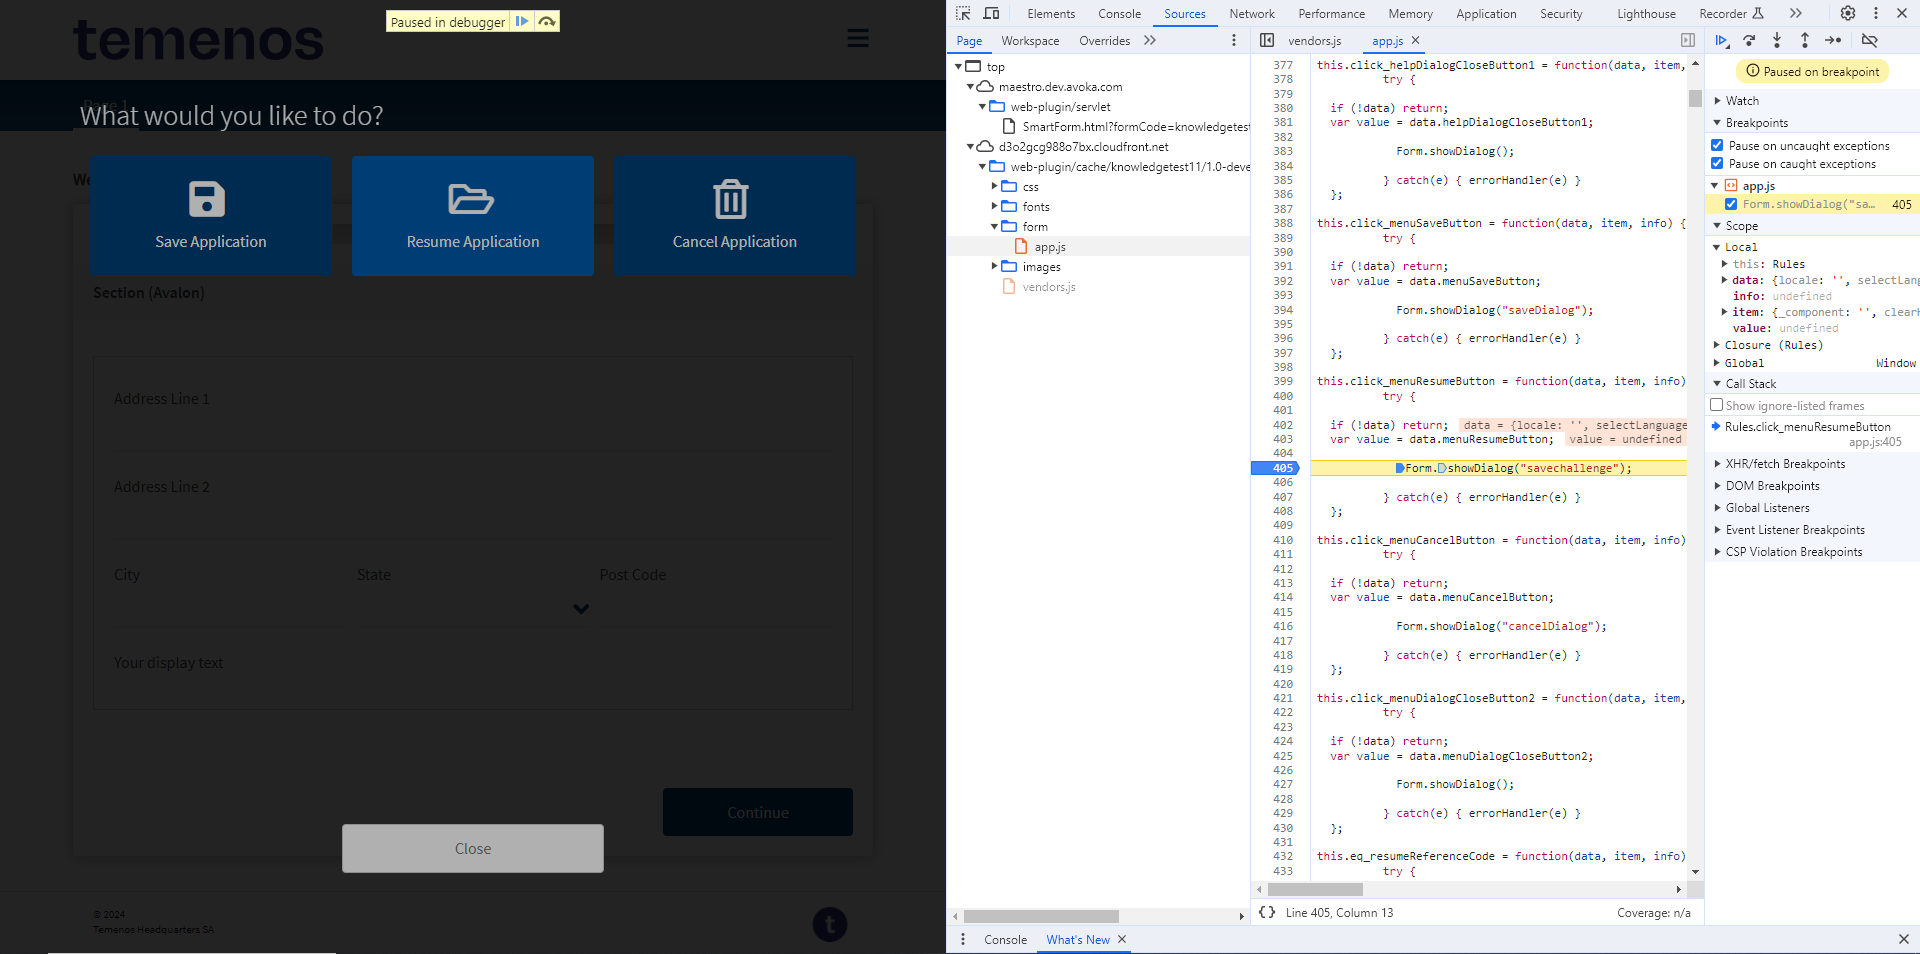
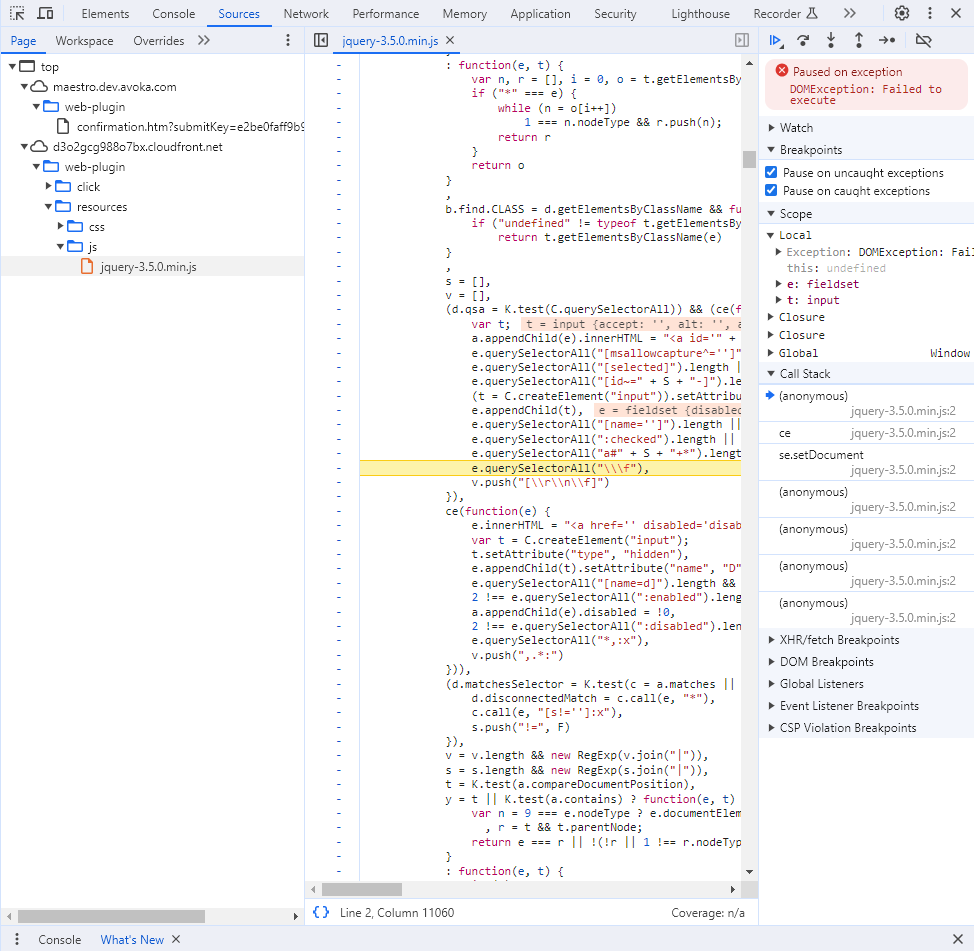
Form.showDialog("savechallenge")line of code and set a breakpoint there. In this example, the code opens the modal window allowing form users to re-open a previously saved form to resume the application. If you're debugging more complicated logic, you can set multiple breakpoints. For more information, see Pause your code with breakpoints. - Select Pause on uncaught exceptions or Pause on caught exceptions to stop a script execution depending on exceptions. Now you are ready to debug the rule. You can return to your form window and perform the action that will trigger the rule to execute and step through your rule script using the standard JavaScript debug functions.
- Click Resume Application to execute the
Form.showDialog("savechallenge")method. However, the modal window doesn't appear. Instead, the line of code where the breakpoint is set is highlighted and the Paused in debugger message is displayed to indicate that the execution of the JavaScript has paused on that line. This is illustrated below: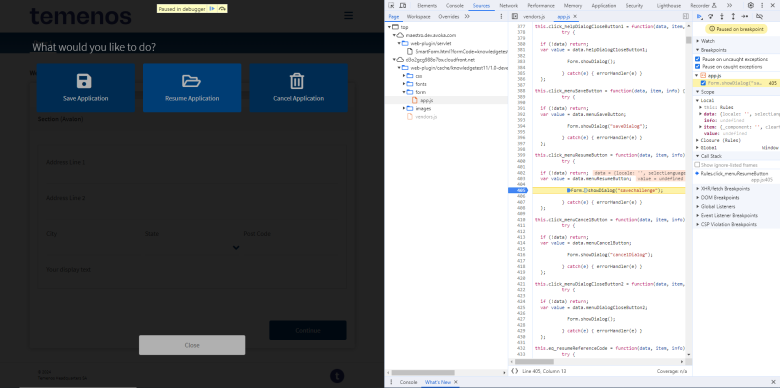
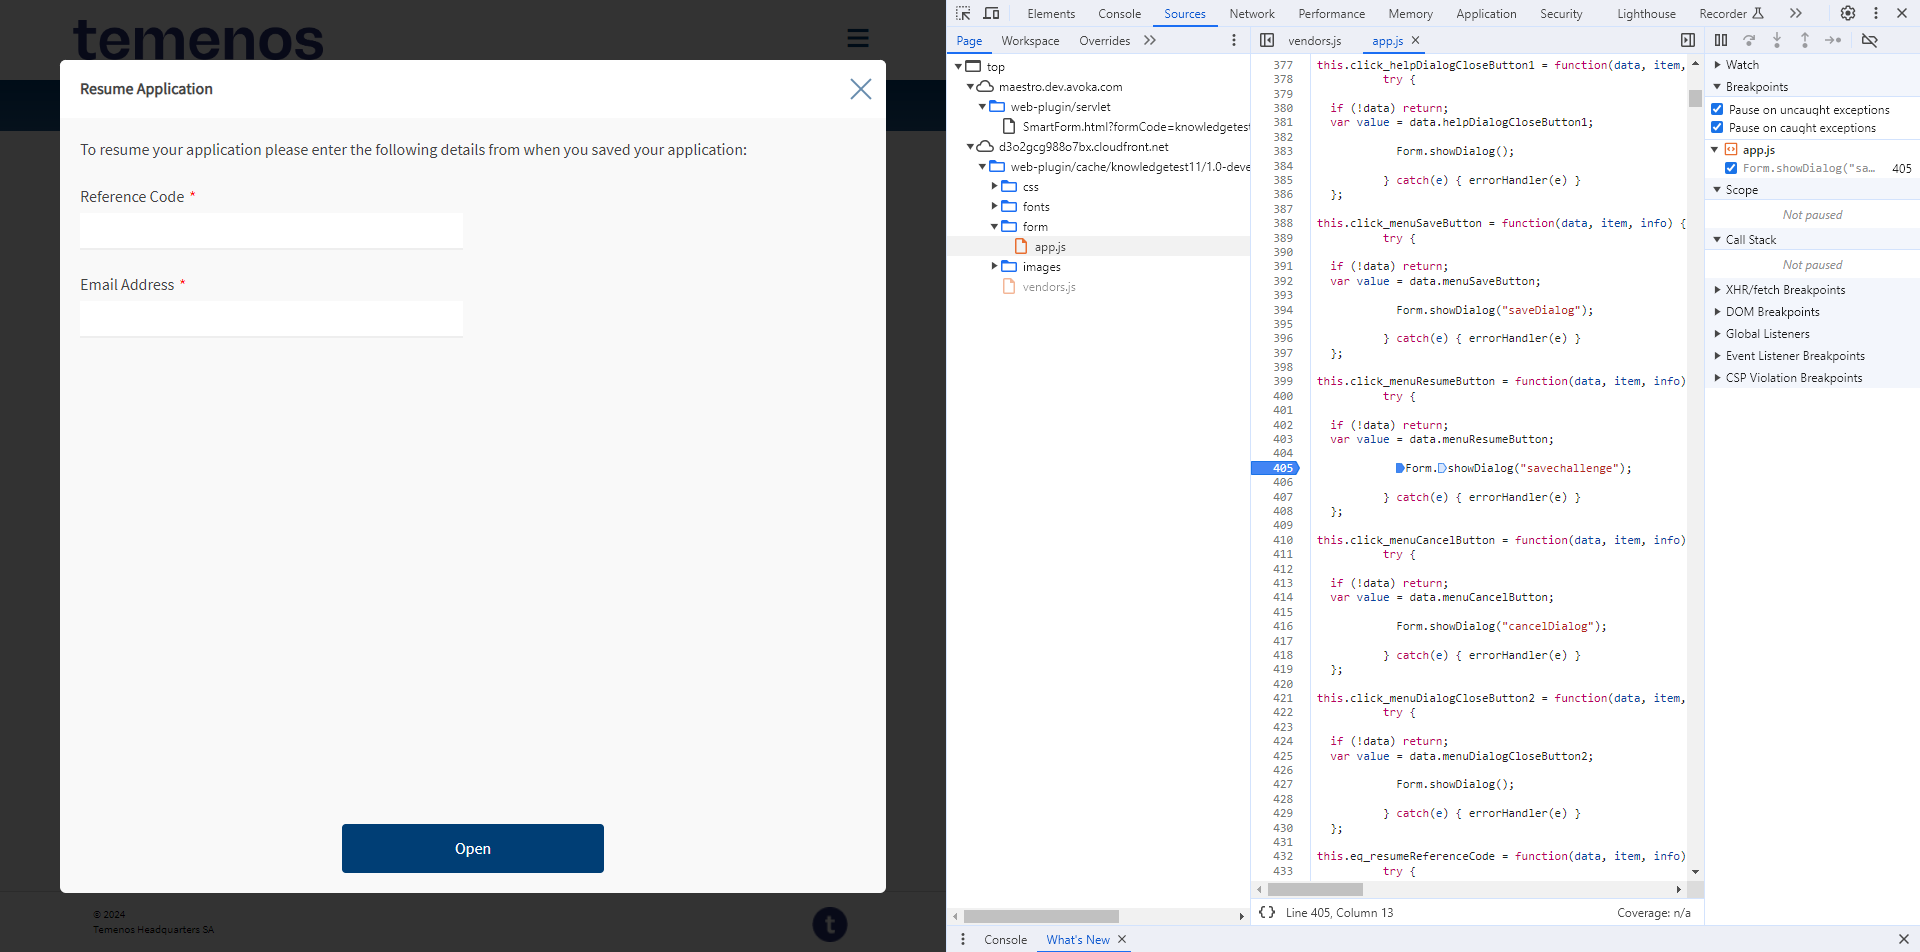
- Click Play to continue executing the script, thereby allowing the modal window to open.
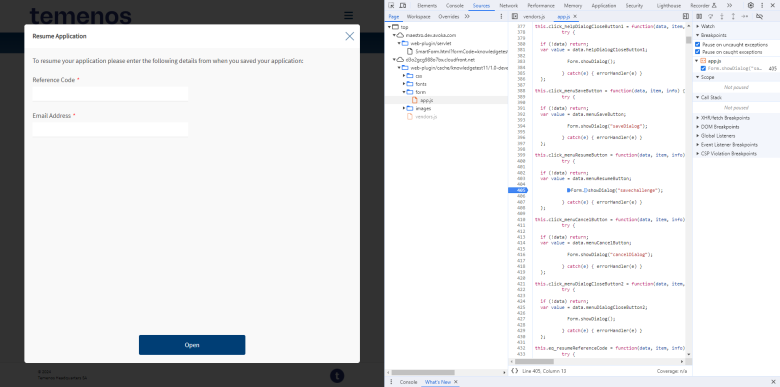
When you continue after each breakpoint, execution of the script will stop at the next breakpoint, allowing you to move step-by-step through a script.
While moving between breakpoints, pay attention to the Scope section, as it shows the current state of the form's data that may provide insight into why something isn't behaving as expected.

As you saw above, it's not difficult to find the app.js file. In an actual form though, the file may contain hundreds of rules, which can make it difficult to find and debug the code for a specific rule. One way is to use the Control+F shortcut to search for a statement from one of the rules. For example, if you know there is a console.log statement in the rule, you can search for console.log. But if you have many rules, which contain similar statements, this maks this approach less convenient. Fortunately, every rule in Maestro has a corresponding JavaScript function that follows a strict naming convention. The functions are named using a rule type code and the ID of the field, with an underscore between them - <rule-type-code>_<field-id>.
For more information, see List of Maestro Rules.
You may need to review your rule script in the Maestro Code editor and select a snippet that is likely to be unique. For example, if you search for the snippet Form.getItemFromPath('data.buttonGroup') and located the function eq_ddLabel that contains the business rule script.
We don't recommend modifying JavaScript in-line in the browser debug tools because results are often unreliable. Instead, you should rebuild and republish a form each time you want to change a business rule.
Debug Form Styles
Maestro forms and templates use CSS extensively. CSS styling can become complicated for big form application. In particular, if two different CSS statements provide conflicting instructions about how to style a particular item, it can be very confusing to debug why your changes do not appear to be working.
To debug styling problems, we recommend using the native debugging features built into your browser of choice, rather than attempting to understand this entirely within Maestro. You need to have a moderate to advanced understanding of CSS to debug styles.
To debug form's styles:
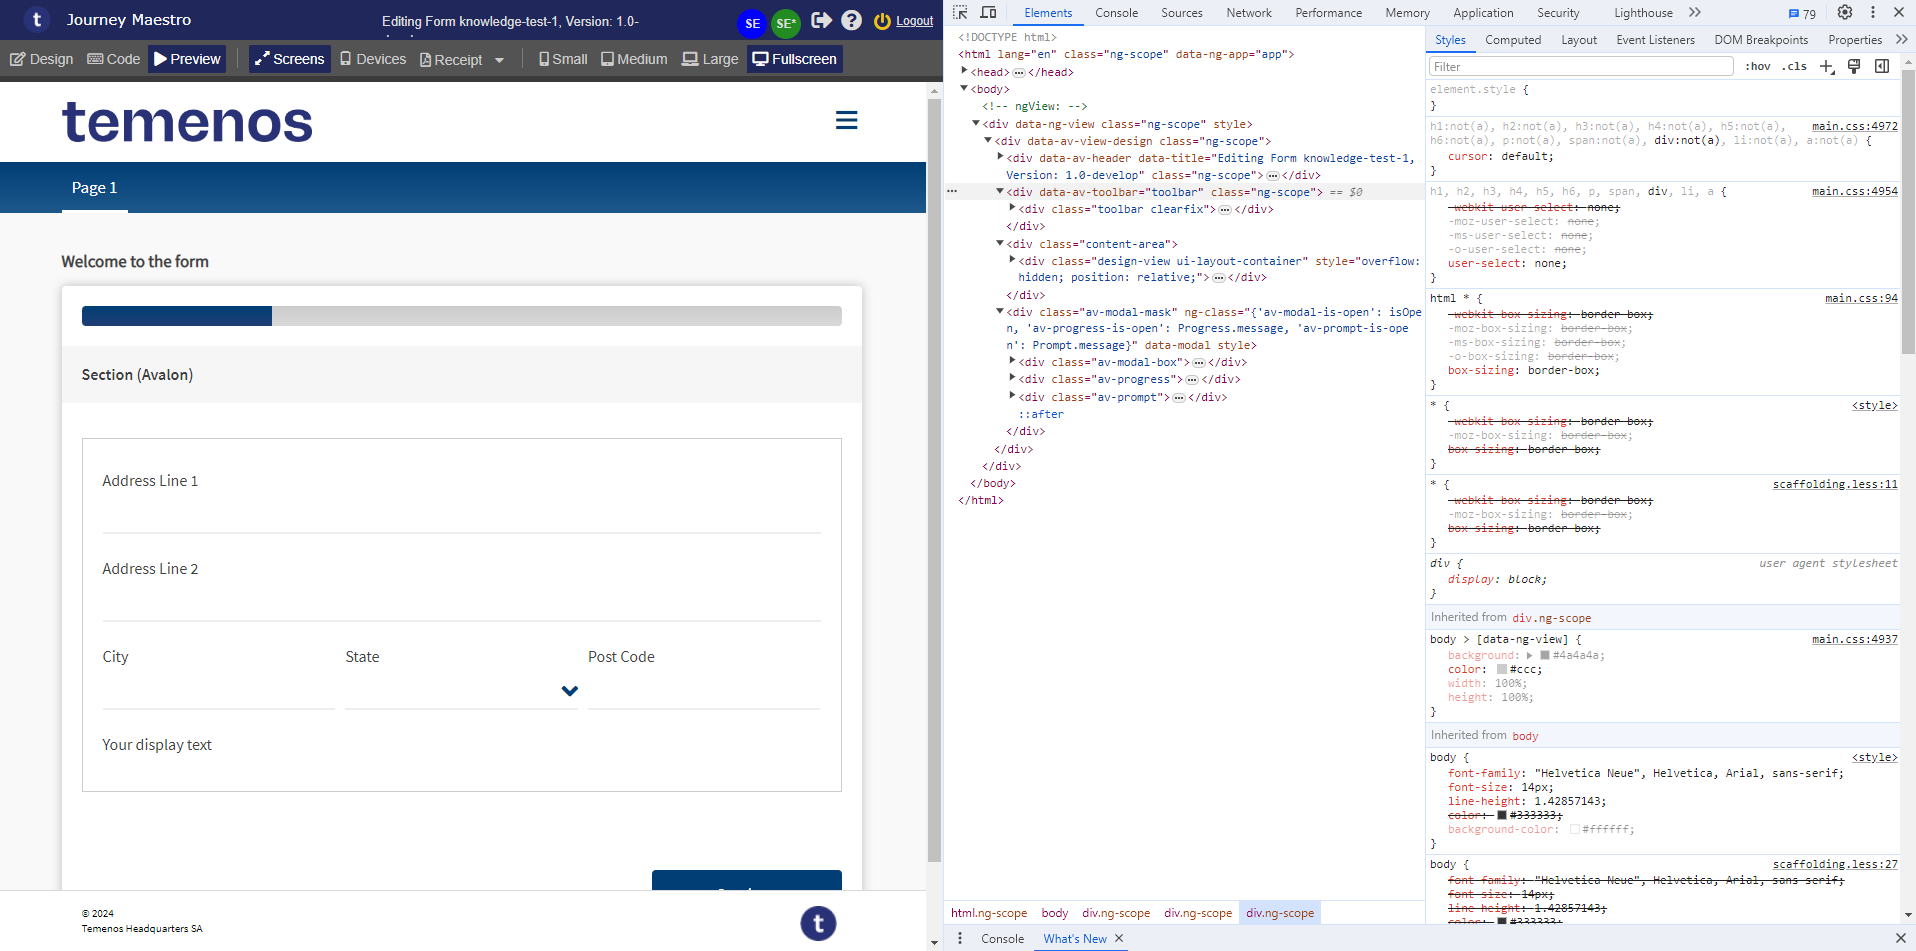
- Select Preview and open Chrome DevTools.
- Select Elements > Styles to explore a style of a selected element of the HTML form. This is shown below:
When there are style conflicts, the usual CSS rules apply:
- If two identical instructions are processed, the one that is later in the CSS definition will override the earlier one.
- The more specific the CSS selector, the higher it's precedence.
- Precedence can be fine-tuned by adding the
!Importantdeclaration.
Next, learn about UI test automation.