User Journey View Overview
Journey Analytics The behavioural analytics tool. | Analytics User | Latest Version Latest version 23.04.0 cloud hosted.
The Journey Analytics User Journey View is available from v18.05 and presents an easy to follow diagram that illustrates all possible journey paths taken by users through an application.
By default, the User Journey graph shows the standard milestones Started and Completed. Using custom milestones, sent via Milestone APIs from a supported application or host system, you can customize the nodes that display on the graph. You can select one or more custom milestones to display the most relevant data for analysis.
Important:
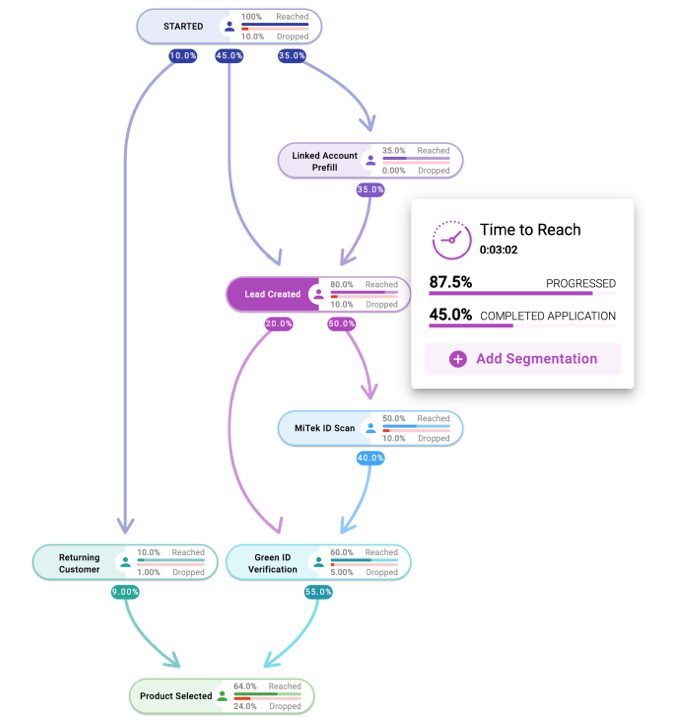
- Each node in the graph represents a milestone.
- At each milestone, the number of users who reached this point in the journey are shown.
- Also, the number of users who reached this milestone, and dropped out of the application is shown.
- Additional metrics are presented when a milestone is selected.
- Segmentation charts, which let you break down each milestone encountered, can be added for any of the displayed milestones.
- Any number of segmentation charts can be added, on any milestone, as long as they are pre-configured and associated transactions have occurred.
User Journey View
Tip
To monitor changes to User Journeys over time, it is recommended to use form versioning in Maestro to isolate particular versions of a form, and to carefully select the timeframes the specific form versions were in use, to use as a comparison.
Video
Watch the video for an introduction to the User Journey View, Milestones and Segments.
Next
Next, learn about Using the User Journey View and How to Send Custom Milestones and Segments.