Analyze Transaction Trend
Journey Manager (JM) The transaction engine for the platform. | Analytics User | 22.10This feature was updated in 22.10.
Manager provides an easy to use tool to visualize and analyze transaction trends using the following charts:
- Transaction volume
- Completion rate
- Conversion rate
- Form abandonment rate
- Bounce rate
- Median form completion time taken by users to complete a submission.
Transactions are often long running and can take many days or even weeks to complete, so Manager makes the following assumptions while calculating the trends:
- Analytics for completion, conversion, form abandonment, and bounce rates exclude in-progress transactions, such as opened, saved, and assigned.
- Completion, conversion, form abandonment, and bounce rates are trailing indicators which become more accurate over time.
- Daily bounce rates and form started abandonment rates become available 48 hours after forms were first opened (request time).
- The start date and end date filters are based on the transaction request time (start time).
- Analytics exclude collaboration job, task, and Manager server monitoring transactions.
All transaction trend charts display a daily value on the x-axis. If the selected date range is too wide, Manager plots the trend graph for every two or more days to fit this date range in the given screen size, so we advise you to restrict date filtering to shorter ranges. However, you can see an exact daily figure for volume, percentage, rate, and time, by hovering over specific points plotted on any of the graphs.
You can also use Journey Analytics to analyze transaction trends as it provides more options to drill down into user transactions and better visualization. You will, however, need the Journey Analytics module installed in your Manager environment.
Manager and Journey Analytics calculate transaction trends differently depending on multiple factors, such as analytics implementation, and are beyond the scope of this documentation.
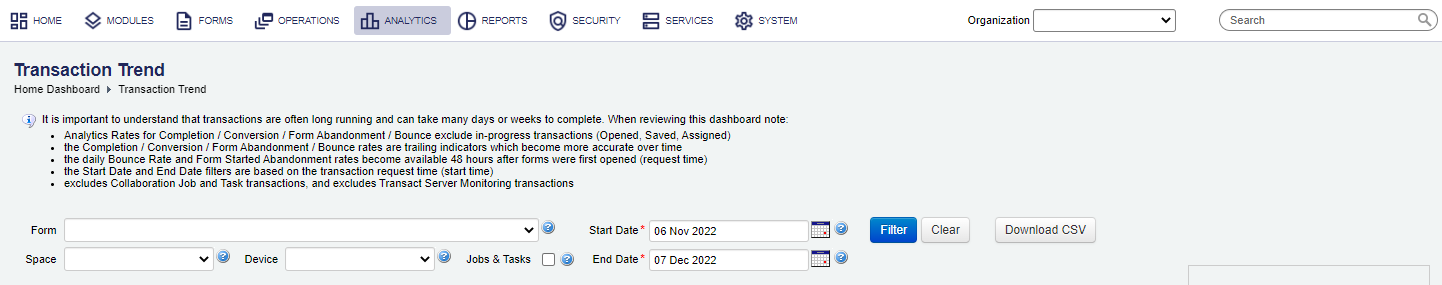
To view the transaction trend:
- Select Analytics > Transaction Trend.
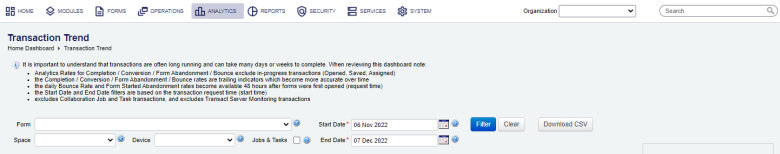
- Select an organization from the Organization dropdown list to retrieve statistics relevant to this organization only. If not selected, statistics for all organizations is shown.
- Select a form from the Form dropdown list to include only the transactions related to that form. If left blank, the transactions related to all forms are included in the chart.
- Select a form space from the Space dropdown list to include only the transactions of that form space.
- Select a device from the Device dropdown list to include transactions accessed by users from the following devices:
- Desktop
- Phone
- Tablet
- Select the Jobs & Tasks checkbox to include collaboration job and task transactions. Otherwise, they are excluded. | 18.05 This feature was introduced in 18.05..
- Specify the date range of transactions to be included in the chart from the Start Date and the End Date. By default, this is set to a date range starting one year before, up to and including today.
- Click Filter to generate the transaction trends based on the selection criteria and review them as shown below.
The maximum date range is 6 months only.
Transaction Volume
This chart displays the number of Opened (both started and bounced) and Completed transactions per day. Transactions completed on a later date are counted against the day they were started. Transactions not completed on the same day as they were started, appear against their start date and not their completion date. Collaboration job and tasks are not included.
The opened transactions are plotted in yellow and the completed transactions are plotted in blue.
Completion Rate (%)
This chart provides the percentage completed transactions divided by the number of started form transactions excluding bounced transactions as they are typically form visits where the user did not start filling in the form.
Conversion Rate (%)
This chart provides the percentage completed transactions divided by the number of opened transactions or visits (includes bounces). Form bounces or visits are included in the conversion rate. | 17.10 This feature was introduced in 17.10.
Form Abandonment Rate (%)
This chart displays the percentage breakdown of the different types of user abandonment (never completed or submitted). These types of form abandonment include:
- Ineligible - the form determined that the user is not eligible to complete the transaction, and the transaction was terminated.
- User Cancelled - the user explicitly clicked on the Cancel form button. Note not all form designs include this button. This information becomes available immediately.
- User Saved - the user has explicitly saved the form and then closed it but has never returned to resume the form. This type of abandonment is determined over time, and can take up to 30 days depending upon the form's configuration.
- Form Started - the user has started interacting with the form (entering data, clicking on buttons or navigating around) but they never perform an explicit save or submit. Form Start abandonment is determined 24 hours after the transaction has been opened.
Bounce Rate (%)
This chart displays the percentage of bouncedBounce is when a user views a form but never starts it and simply closes the window immediately or navigates away. transactions divided by opened (rendered) transactions per day.
Median Form Completion Time (mins)
This chart displays the median form completion time in minutes or the cumulative amount of time it took users to complete the transaction, potentially across multiple form sessions.
The averages of the above stats are displayed on the right hand side of the screen.
Manager prior to version 17.10, uses Export Excel Data link instead of the Download CSV button.
Next, learn about all Manager analytics.