Custom Reports View - Top Fields
Journey Analytics The behavioural analytics tool. | Analytics User | Latest Version Latest version 23.04.0 cloud hosted.
This report is a table for comparing and sorting field-level stats such as Abandonment, Completion rate, or Median Time to complete transactions. This data is presented as raw counts and can be used to compare the volume of transactions between the versions.
Configuration
Click  to modify the
configuration options.
to modify the
configuration options.
- Metric - Choose the transaction status or metric to target.
- Abandonment - Shows the number of abandoned transactions in which the field was the last to receive user interaction.
- Completion - Shows the number of times each field was completed.
- Median Times - The median time it took to complete each field.
- Label Fields By - Change the labels to use field path or name.
- Limit - Specify a limit to the number of fields shown.
Example Analysis
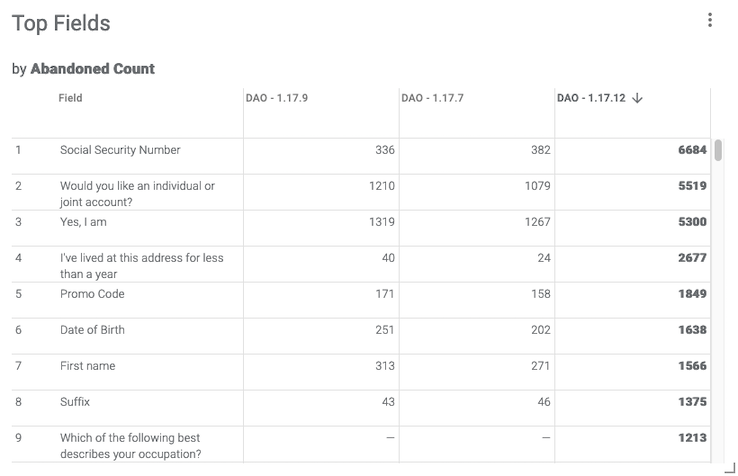
In the example screenshot, because three versions are selected via the Scope Selector, the three form versions’ field-level statistics can be compared. Key takeaways are:
- The configured metric is Abandonment which shows Abandoned Count for each field. This shows the number of abandoned transactions in which this field was the last to receive user interaction (before the user abandoned).
- The bold values indicate the highest value for the field.
- The table has been sorted to show abandonment counts for DAO - 1.17.12 from high to low.
- For DAO - 1.17.12, the Social Security Number field seems to have rather poor performance relative to other fields.
The high abandonment could be due many factors but the Social Security Number field is indicated as an investigative starting point.