Custom Reports View - Segment Split
Journey Analytics The behavioural analytics tool. | Analytics User | Latest Version Latest version 23.04.0 cloud hosted.
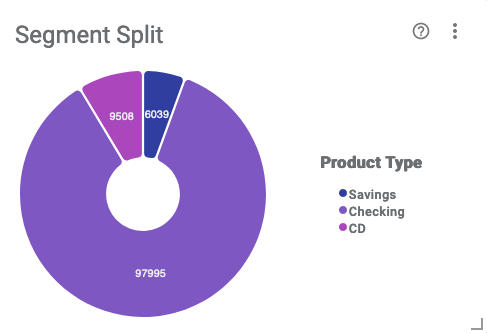
This pie chart shows the breakdown of segment values that were received for a specific segmentation, or segment type, for transactions within the selected scope. The visualization can be used to evaluate and measure segment values that occur during transactions.

Configuration
Click  to modify the
configuration options.
- Segment - Set the segmentation, or segment type, to target. Available options are based on the selected form.
- Group Smallest Values - If many segment values exist, use this option to group lower values as Others.
- Max Legend Items - Set the maximum number of legend items, or segment values, to display.
Example Analysis
In the example screenshot, multiple versions are selected via the Scope Selector, so segmentation data from all selected applications display in a single pie chart. Key takeaways are:
- The pie chart shows a breakdown of segment values within the Product Type segment type.
- For transactions with Product Type segment types, segment values include Savings, Checking and CD.
- The chart indicates that most of the Product Type segmentation is from users applying for Checking accounts.