Analyze Submission Trend
Journey Manager (JM) The transaction engine for the platform. | System Manager / DevOps | 18.05 This feature was removed in 18.05
This functionality has been removed in Manager v18.05. Use transaction trend instead.
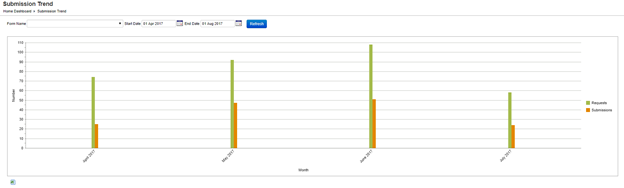
Manager generates charts to visualize the number of form requests compared to the number of completed submissions for each month during the selected date range.
To view the submission trend chart:
- Select Analytics > Submission Trend.
- Select a form from the Form Name dropdown list to see submission trends for a specific form only.
- Specify the date range of submissions to be included in the chart from the Start Date and the End Date. By default, this is set to a date range starting one year before up to and including today.
- Click Refresh to generate the charts based on the selection criteria.
- Click
 to export the displayed data as an XLS file.

Next, learn about transaction trends.