Analyze Forms Activity
Journey Manager (JM) The transaction engine for the platform. | System Manager / DevOps | 18.05 This feature was updated in 18.05.
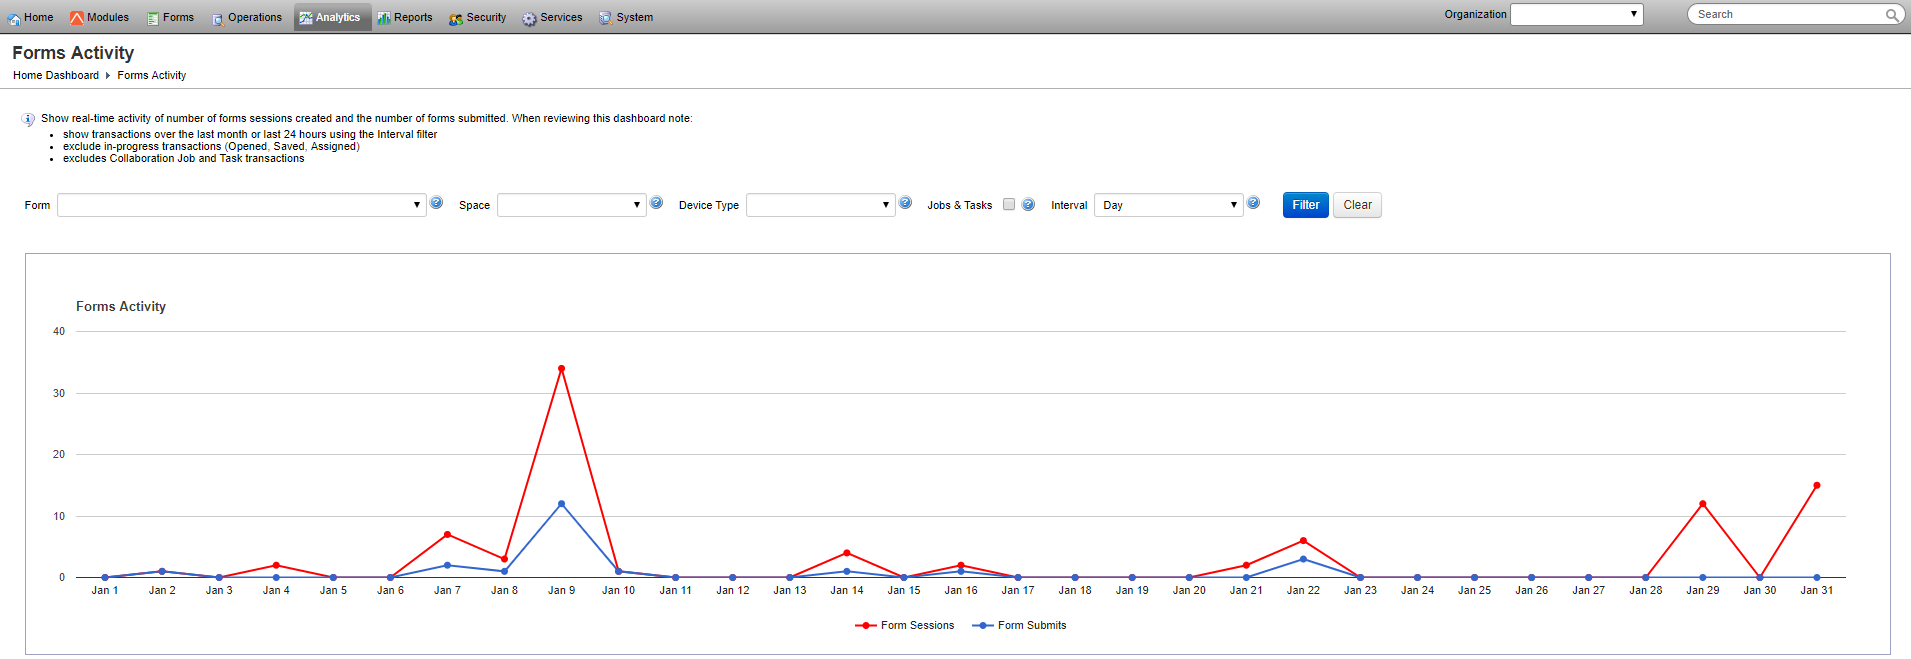
Manager generates this chart to visualize the real-time activity of the number of form sessions created and the number of forms submitted. The following assumptions are applied:
- The chart shows transactions over the last month or last 24 hours depending on the filter selection.
- The chart excludes in-progress transactions, such as opened, saved, assigned, collaboration job, and task transactions.
To view the forms activity chart:
- Select Analytics > Forms Activity.
- Select an organization from the Organization dropdown list to retrieve statistics relevant to this organization only. If not selected, statistics for all organizations is shown.
- Select a form from the Form dropdown list to include the transactions related to that form only. If left blank, the transactions related to all forms are included in the chart.
- Select a form space from the Space dropdown list to include the transactions of that form space only.
- Select a device from the Device dropdown list to include transactions accessed by users from the following devices:
- Desktop
- Phone
- Tablet
- Select the Jobs & Tasks checkbox to include collaboration job and task transactions. Otherwise, they are excluded. | 18.05 This feature was introduced in 18.05..
- Select an activity interval from the Interval dropdown list, which can be one of the following:
- Day - to see the daily form activity for the last month. This is the default.
- Hour - to see the hourly form activity for the last 24 hours.
- Click Filter to generate the chart based on the selection criteria.
Next, learn about referrer submissions.