Analyze Form Submissions
Journey Manager (JM) The transaction engine for the platform. | System Manager / DevOps | 18.05 This feature was updated in 18.05.
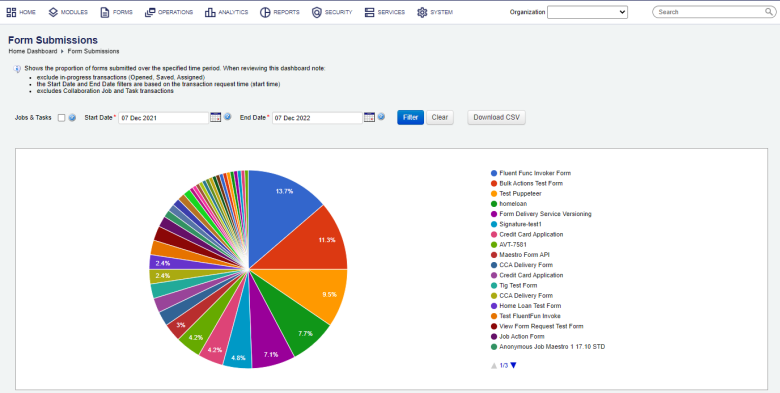
Manager generates this chart to visualize the most active forms and the proportion of forms submitted over the specified time period. The following assumptions are applied:
- Charts exclude in-progress transactions, such as opened, saved, assigned, collaboration job and task transactions
- The Start Date and End Date filters are based on the transaction request time (start time)
To view the form submissions chart:
- Select Analytics > Form Submissions.
- Select an organization from the Organization dropdown list to retrieve statistics relevant to this organization only. If not selected, statistics for all organizations is shown.
- Select the Jobs & Tasks checkbox to include collaboration job and task transactions only. Otherwise, they are excluded. | 18.05 This feature was introduced in 18.05.
- Specify the date range of submissions to be included in the chart from the Start Date and the End Date. By default, this is set to a date range starting one year before up to and including today.
- Click Filter to generate the chart based on the selection criteria.
- Click Download CSV to export the displayed data as a CSV file.
Note Manager prior to version 17.10, uses Export Excel Data link instead of the Download CSV button.
- Click up and down arrows to scroll the list of the forms visualized on this pie chart

You can see the form name and the total number of submissions made for each form by hovering the mouse over the chart slice.
The chart legend is shown on the right-hand side of the chart with forms ordered according to highest percentage of submissions.
Next, learn about device type submissions.