Analyze Device Type Submissions
Journey Manager (JM) The transaction engine for the platform. | Analytics User | 18.05 This feature was updated in 18.05.
Manager generates charts to visualize the proportion of browsers and operating systems used for form transactions for a specified time period. The following assumptions are applied:
- Charts exclude in-progress transactions, such as opened, saved, assigned, collaboration job and task transactions.
- The Start Date and End Date filters are based on the transaction request time (start time).
To view the device types submissions charts:
- Select Analytics > Device Types Submissions.
- Select an organization from the Organization dropdown list to retrieve statistics relevant to this organization only. If not selected, statistics for all organizations is shown.
- Select a form from the Form dropdown list to include the submissions of that form only. If left blank, submissions of all forms are included in the charts.
- Select the Jobs & Tasks checkbox to include collaboration job and task transactions only. Otherwise, they are excluded. | 18.05 This feature was introduced in 18.05..
- Specify the date range of submissions to be included in the chart from the Start Date and the End Date. By default, this is set to a date range starting one year before up to and including today.
- Click Filter to generate the charts based on the selection criteria.
- Click Download Browser CSV to export the browser submissions data as a CSV file.
- Click Download OS CSV to export the operating system submissions data as a CSV file.
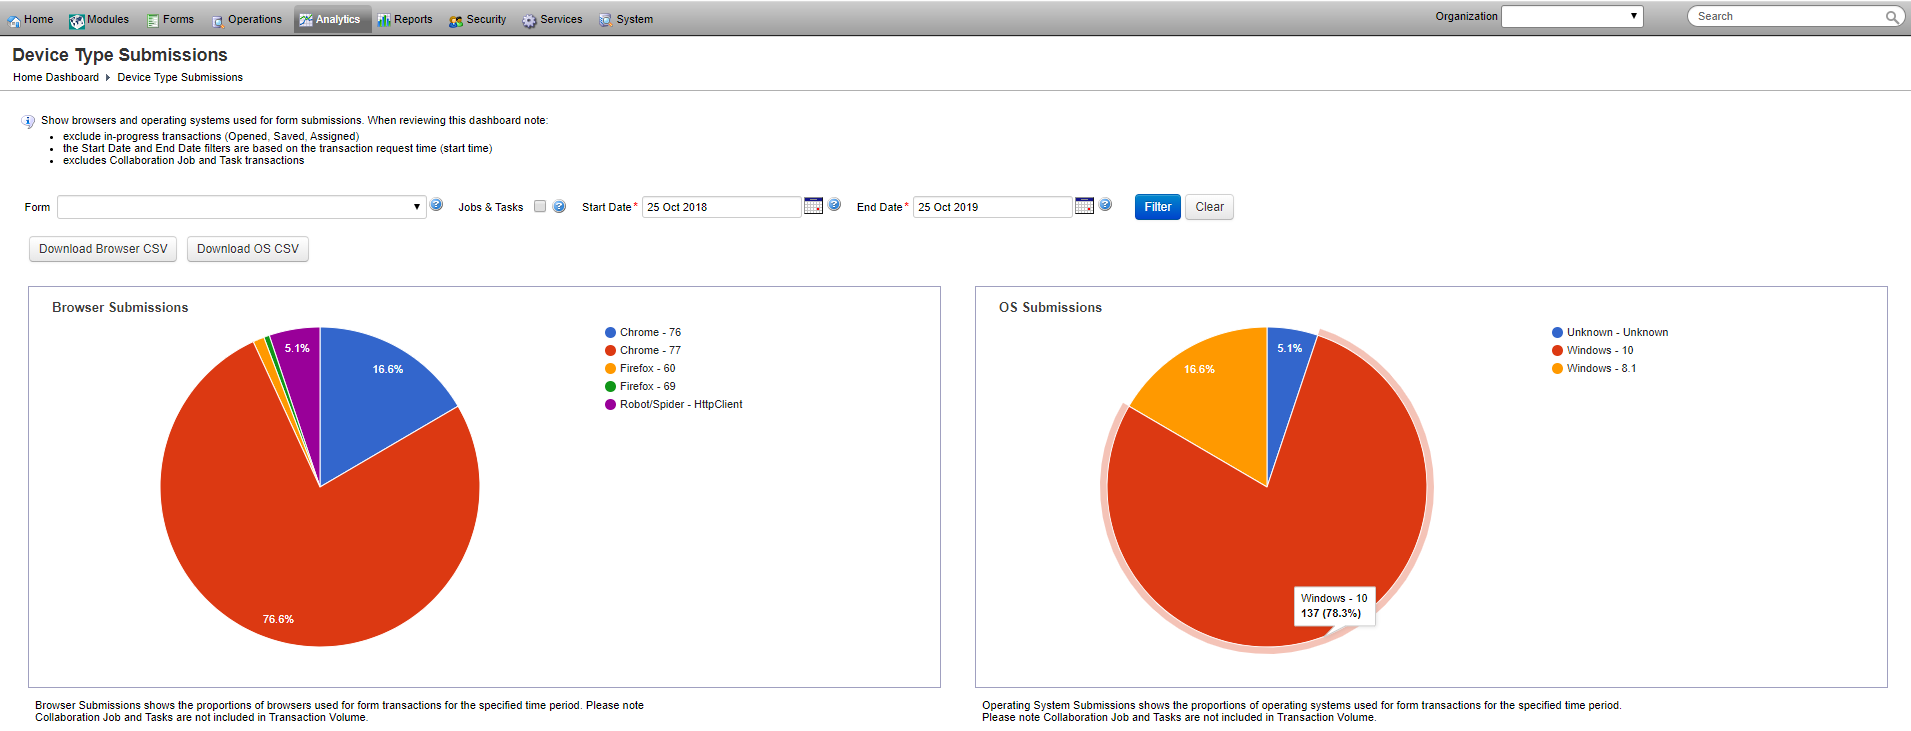
Manager prior to v18.05 has two separate charts: browser submissions and OS submissions.
Next, learn about reader versions.