Custom Reports View - Median Time
Journey Analytics The behavioural analytics tool. | Analytics User | Latest Version Latest version 23.04.0 cloud hosted.
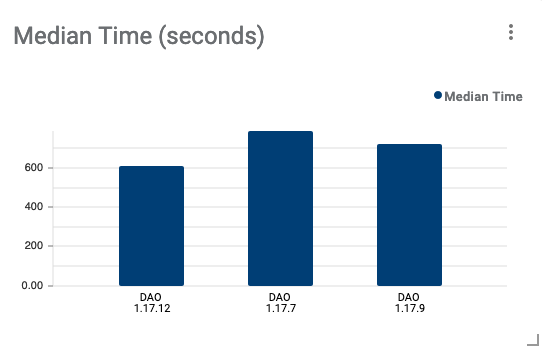
This simple bar chart shows the medianThe median is the middle value in a distribution when the values are arranged in ascending or descending order. time in seconds it took to complete each selected application version.
Configuration
Click  to modify the
configuration option.
to modify the
configuration option.
- Enable Grids - Toggle the grid markings on and off.
Example Analysis
In the example screenshot, three versions are selected via the Scope Selector, so the three form versions can be compared. Key takeaways are:
- It seems that version 1.17.12 is quicker for users to complete.
- Generally, the median time to complete each version has improved with each new form version.
This data supports the case that new optimizations are indeed working as expected to decrease the time users take to complete the application.