Custom Reports View - Best, Worst, Avg
Journey Analytics The behavioural analytics tool. | Analytics User | Latest Version Latest version 23.04.0 cloud hosted.
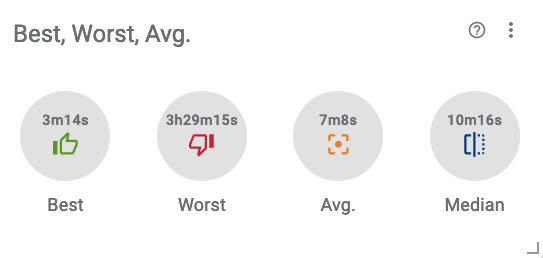
This simple report displays the best, worst and average time taken to complete the applications set by the Scope Selector. Use this information to gain a high-level understanding of the time it takes to complete an application or group of applications.
Configuration
Click  to modify the
configuration options.
to modify the
configuration options.
- Format - Change how durations are formatted on the chart.
- Show Median - Toggle to show median duration stats on the chart.
- Show Avg - Toggle to show average duration stats on the chart.
Example Analysis
In the example screenshot, multiple versions are selected via the Scope Selector so duration data for the entire selection is aggregated. Key takeaways are:
- The best, or fastest, transaction took about 3 mins and 14 seconds to complete.
- The worst, or slowest, transaction took almost 3.5 hours.
- On average, users complete the form in just over 7 minutes.
- The median time to complete is 10 minutes and 16 seconds.