Advanced Debugging of Maestro Forms
MaestroThe UI design product. | Form Builder | All versions This feature is related to all versions.
Occasionally, while developing Maestro forms, you may see a behavior that doesn't seem right and you can't figure out why. This usually occurs in relation to rules that you've created using the script editor. It's very important to understand the form architecture before you delve into form debugging, as there are certain assumptions of how the 3 form elements are used in interact within the form.
You can learn how to do the basic debugging of Maestro forms, but sometimes you need to apply more advanced debugging techniques that you can use to find out what is going on in your script and in the form data, especially debugging CSS and styling issues are not covered.
Recommended Skill Set
Debugging Maestro forms in the browser is a technical task and requires some understanding of web application development in general, specifically the web standards of HTML, CSS and JavaScript.
Additionally, forms produced by Maestro run on AngularJS, which is a JavaScript based open-source front-end web application framework backed by Google. There is a very strong community supporting this technology and while it is not required that you are familiar with AngularJS, it would be a benefit for you to have some basic knowledge of the framework. We would recommend you review the tutorials to develop your understanding of this technology:
Debugging Tools
Before getting started, ensure you have appropriate tools for debugging JavaScript in the browser. These include:
Modern Browser
Most modern browsers come with good developer tools these days. We prefer to use Google Chrome, but Firefox and Microsoft Edge can also be used. This article assumes you are using Google Chrome, which we recommend.
Developer Tools Enabled
All these browsers come with developer tools out of the box and allow you to install plug-ins and extensions to provide additional capabilities. There are a number of ways to enable these developer tools, but universally, hitting the F12 key while viewing a page will bring up the built-in developer tools.
After that, you can run various commands in the console to print form's data. For example, you can use console.log(maestro.Form.getDataXml(true)) to list the /SFMData/SystemProfile content as an XML file, as shown below:
<AvokaSmartForm>
	<AboutYou>
		<FirstName>
		</FirstName>
	</AboutYou>
	<SFMData>
		<SystemProfile>
		<FormCode>Test 1</FormCode>
		<RequestLogKey>12345</RequestLogKey>
		<DisplayMode>Entry</DisplayMode>
		<ServerBuildNumber>22.4.0</ServerBuildNumber>
		<RevisionNumber>0</RevisionNumber>
		<FormDataServiceURL>https:/[/YOUR-SERVER-HOST-NAME]/web-plugin/servlet/FormDynamicDataServlet</FormDataServiceURL>
		<TrackingCode>ABCD1234</TrackingCode>
			<AbandonmentReason>
			</AbandonmentReason>
			<AbandonmentComments>
			</AbandonmentComments>
		</SystemProfile>
	</SFMData>
</AvokaSmartForm>
AngularJS Browser Plugin
Maestro forms are built on the AngularJS framework and plugins are available to provide specific support for AngularJS web applications. In Chrome, we use AngularJS Batarang, Firefox also has AngularJS plugins that may provide the same capability.
Publishing Forms for Debug
When you publish a Maestro form there are a number of options available to you.
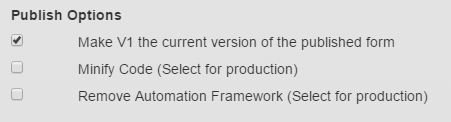
Some of these are very relevant to debugging, these are:
| Publish Options | Description |
|---|---|
| Minify Code |
Deselect this option. Code minification is the process of compressing code to reduce the size and therefore load time, but does not affect the operation of the code. The process removes unnecessary characters from the code,white space, new line, comments etc... The result of minification is a single line of code that is very long and difficult to read and debug so ensure that this option is deselected for debugging. |
| Remove Automation Framework |
Deselect this option. The automation framework built into Maestro forms facilitates UI driven automated tests such as those that would be run from test tools like Selenium. This framework also contains some features that will assist in debugging JavaScript so it is handy to keep the automation framework for debugging. |
Activating a Debug Session
To start a debugging session you should:
- Load the published Maestro form in a modern browser of your choice
- You must access the published version of the form, DO NOT try and debug a form in Preview mode in the Maestro designer.
- If you are intending to debug JavaScript (e.g. Maestro rules) then ensure you have deselected the Minify Code and Remove Automation Framework publish options as described above.
- Once the published form is loaded in the browser you can activate the browser developer tools by hitting the F12 key.
Shortcuts for Republishing Forms
While debugging forms you may need to republish your form with changes multiple times and you need to refresh the page with your published form on it each time. The following keyboard shortcuts are available for you to use to streamline this process:
- CTRL-P: When used from the Maestro Design page will bring up the Publish dialog. (Command-P on Mac)
- CTRL-ENTER: Will trigger the publish function. Remember to deselect the Minify Code publish option first.
- CTRL-TAB: This will switch you to the last active browser tab which in most cases will be the published form.
- CTRL-R: Will refresh the currently active browser window.
Refreshing the page with the republished form on it should leave the browser developer tools active so you should not need to reactivate them each time.
Inspecting the Form Object
In the Maestro framework, the Form object contains everything else you might need to access for debugging including the View, Items and Data (see Maestro Form Architecture), so to access any of these elements you need to scope the Form object. There are a number of ways to do this from the Console tab in the browser developer tools:
- Using JQuery you can scope the form object in this manner:
$("Form").scope().Form - If you have included the Automation Framework (see Publishing Options) you can short cut this access by using the maestro root element included with that framework:
maestro.Form - If you have AngularJS Batarang (or similar) installed, they may also allow you to access the Form object by way of the $scope object (You need to select an element in the Elements tab first - e.g. body or form):
$scope.Form
Enter one of these directives into the Command prompt in the Console tab and press Enter to scope the Form object:
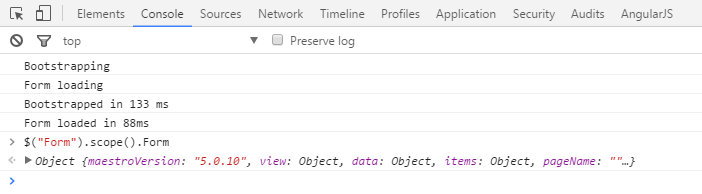
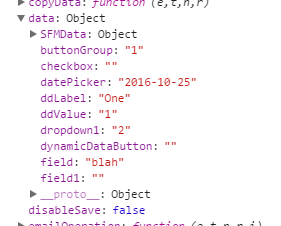
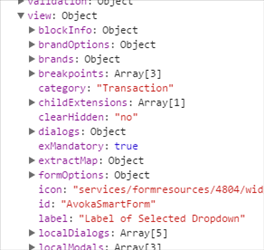
Opening up this object you will see a long list of sub elements but among those you will find the 3 key elements to the Maestro Form Architecture, the Form Data object,
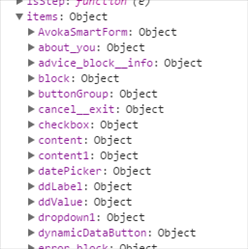
The Form Items,
And the Form View.
Of course, if you have a JavaScript debugging session active (as described below) you will have access to the Form Data object in the function scope and can readily inspect its contents.
Logging an Item to the Console
There is a handy Util function to generate a printable representation of an item and log it to the console as follows:
$scope.Util.logItem($scope.Form.items.personalDetailsBlock)

"personalDetailsBlock
┌ firstName
└ middleNames
─ lastName
─ dateOfBirth
 ┌ day
 │ month
 └ year
 ─ date
 ─ daysData
─ emailAddress
─ mobileNumber
"
Locating a JavaScript Rule for Debug
All rules in Maestro are implemented as JavaScript so to locate the logic implemented in a Maestro rule you must find the JavaScript code that implements that rule. You can do this as follows:
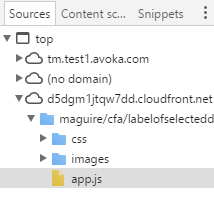
- In the developer tools window select the tab that lists the page source files (in Chrome this is titled Sources).
- Open the app.js file by either using CTRL-O (CMD-O on Mac) and typing in the name of the file, or by searching in for it the file sources hierarchy then double-click to open it (the location of this file will vary depending on your installation and the existence of a CDN in your environment, but it should only be a couple levels deep).
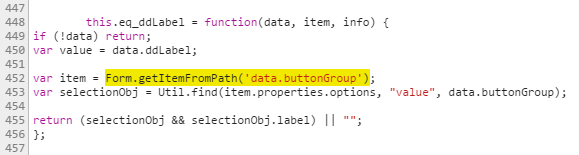
- In the app.js file, search for and locate the JavaScript function that contains your rule in the app.js file. There are several ways to do this depending on the capabilities of the browser dev tools, but most commonly you will search by a code snippet or by the function name:
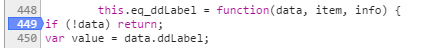
- To find the function using a code snippet, select a snippet of code from your rule script by clicking in the app.js file and using CTRL-F to activate the find feature. You may need to review your rule script in the Maestro designer and select a snippet that is likely to be unique. For example, below I have searched for the snippet Form.getItemFromPath('data.buttonGroup') and located the function eq_ddLabel that contains my rule script:
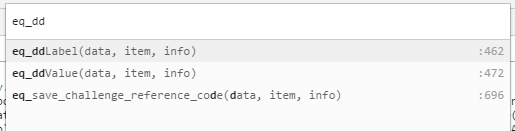
- To search by JavaScript function name you will need to know the naming conventions for these functions (see the section on JavaScript Function Naming below). If you know the function name you can either search for the function name as a snippet (as above) or if your dev tools support it you can use the JavaScript Member search capabilities - in Chrome this can be activated using CTRL-SHIFT-O:
- To debug your rule, set a break-point on one of the lines before the code you want to step through by clicking in the left column area and confirming the break-point indicator:
- Now you are ready to debug the rule. You can return to your form window and perform the action that will trigger the rule to execute and step through your rule script using the standard JavaScript debug functions.
A word of caution against modifying JavaScript in-line in the browser debug tools. Results of this sort of change are often unreliable. While it is less convenient to republish a form each time you want to change a rule - this is the recommended approach.
Next, learn about UI test automation.