Understanding Milestones and Segments in Avoka Insights

Being able to dig into an application and understand field level analytics has been a tremendous value to our customers. This ability has made Avoka Insights a critical part of our offerings. Insights presented the ability to understand when and where difficulties converged into various pages or fields of an application. Enabling our customers to then make actionable decisions on what kinds of changes would likely create better completion rates. While this enabled our customers to understand what was happening when applications were utilized, it did not tell them a whole lot about the customer, or if specific groups of customers responded differently when filling out the application.
To tackle this challenge Avoka added Milestones and Segments to our Insights Platform. This feature allows applications to be constructed in such a way that they expose information from the transaction for analytical purposes. Allowing a much clearer story to be passed through about the consumer.
Milestones are a way to track information as it would be if the consumer made decisions about a path that they were walking. Take this application decision structure as an example.
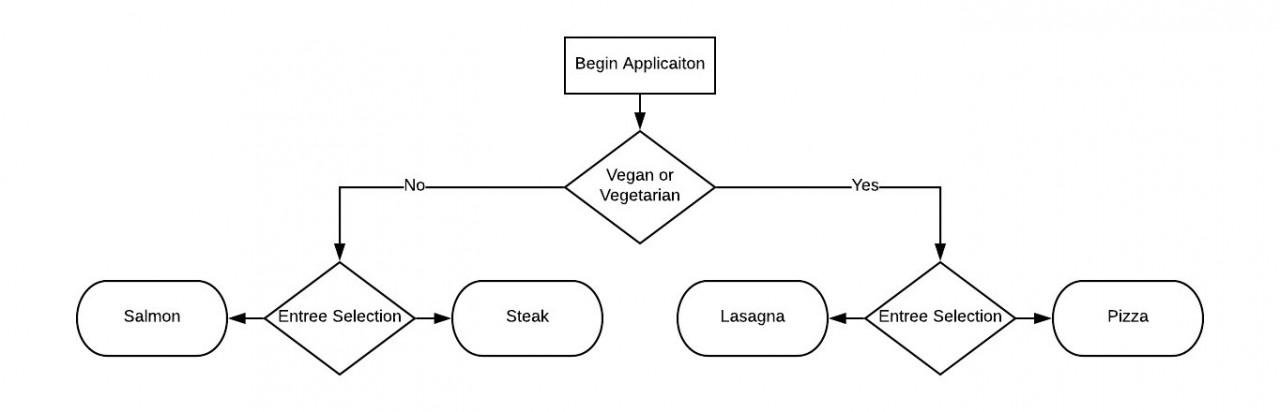
At the start they decide if they are or are not a Vegan or Vegetarian. Then they choose an entrée type. In the end we understand that each customer has chosen a path that has resulted in the selection of an entrée. On the page submit a simple declaration is added reflecting the choice made in a milestone.
Page One
1. Are you a vegetarian or vegan?
- Yes = Insights.milestone(“Vegetarian or Vegan”);
- No = Insights.milestone(“Omnivore”);
Page Two (based on selection type of page 1)
- Entrée Selection
- Salmon = Insights.milestone(“Salmon”);
- Steak = Insights.milestone(“Steak”);
- Lasagna = Insights.milestone(“Lasagna”);
- Pizza = Insights.milestone(“Pizza”);
At the end of this we have a picture illustrating a journey that declares either Vegetarian/Vegan OR Omnivore. Followed by a path to the entrée they selected. As the applicants are processed, making their selections we can see statistical reflections about how many applicants took what path.
As an example, we might see the following:
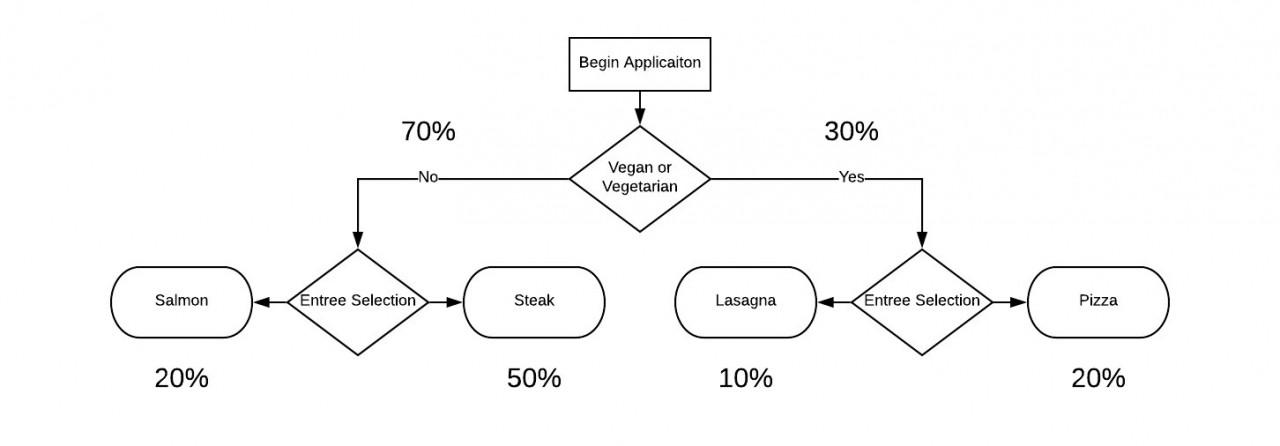
This is very helpful in starting to understand the consumer. From this fictitious example we would be able to understand that 30 percent of our consumers were not Omnivores and that steak is preferred more than 2x as often as salmon.
So how can we understand even more?
Segments gives us this ability! Segments allow us to understand trends that might exist by tracking them against milestones. For our example, we are going to imagine that we collected some very basic demographic information as milestones.
When the application begins we ask for: Gender, Age and State. Those pieces of information are kept and applied to the pages as the applicant progresses.
Page One
- Are you a vegetarian or vegan?
- Yes = Insights.milestone(“Vegetarian or Vegan”);
- No = Insights.milestone(“Omnivore”);
- Gender
- insights.segment(“Gender”, “Male”);
- insights.segment(“Gender”,”Female”);
2. Age
a. Insights.segment(“Agegroup”,”20-30”);
b. Insights.segment(“Agegroup”,”31-40”);
c. Insights.segment(“Agegroup”,”41-50”);
d. Insights.segment(“Agegroup”,”51-60”);
3. State (Logic to break states into regions)
a. Insights.segment(“Region”,”Northwest”);
b. Insights.segment(“Region”,”Southwest”);
c. Insights.segment(“Region”,”Northeast”);
d. Insights.segment(“Region”,”Southeast”);
e. Insights.segment(“Region”,”Midwest”);
Page Two (based on selection type of page 1)
- Entrée Selection
- Salmon = Insights.milestone(“Salmon”);
- Steak = Insights.milestone(“Steak”);
- Lasagna = Insights.milestone(“Lasagna”);
- Pizza = Insights.milestone(“Pizza”);
Once the segments are added the Milestones pickup more information about who the consumer is and what might be behind the choices. With the segments applied to the milestones we now might know the following:
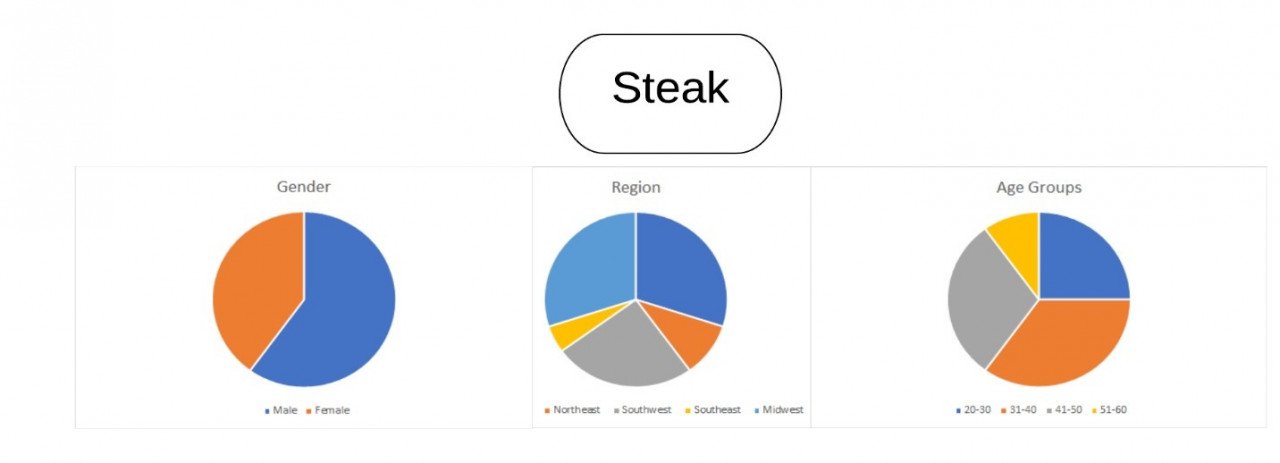
This helps us understand that more Males order steak. It also allows us to understand that older people were less fond of steak. And that people from the Northwest and people from the Midwest both enjoy steak equally.
If you are really into data, you may have already arrived at my last point. That the arrangement of milestones and segments together can paint a very detailed picture of who the consumer is. In the example above, it may be hard to tell exactly what you might want to know by the way the data is arranged. But, by simply changing the milestones we can separate out groups of individuals and then follow their path through the application. Each structure can be uniquely considered to be arranged in such a way that divulges the information you want to obtain. For example, you may want to make the male and female demographic selection a milestone and follow the application process from there, so you understand the meal selection with respect to region and age group within the constraints of gender.
Page One (
- Are you a vegetarian or vegan?
- Yes = Insights.milestone(“Vegetarian or Vegan”);
- No = Insights.milestone(“Omnivore”);
- Gender
- insights.milestone(“male”);
- insights.milestone(“female”);
While its is a slight nuance, it can turn this data model around in such a way that we could understand the percentage of men from the Midwest that order steak. Whereas in the example above we can only tell the percentage of men that order steak and percentage of all people that order steak in that region.
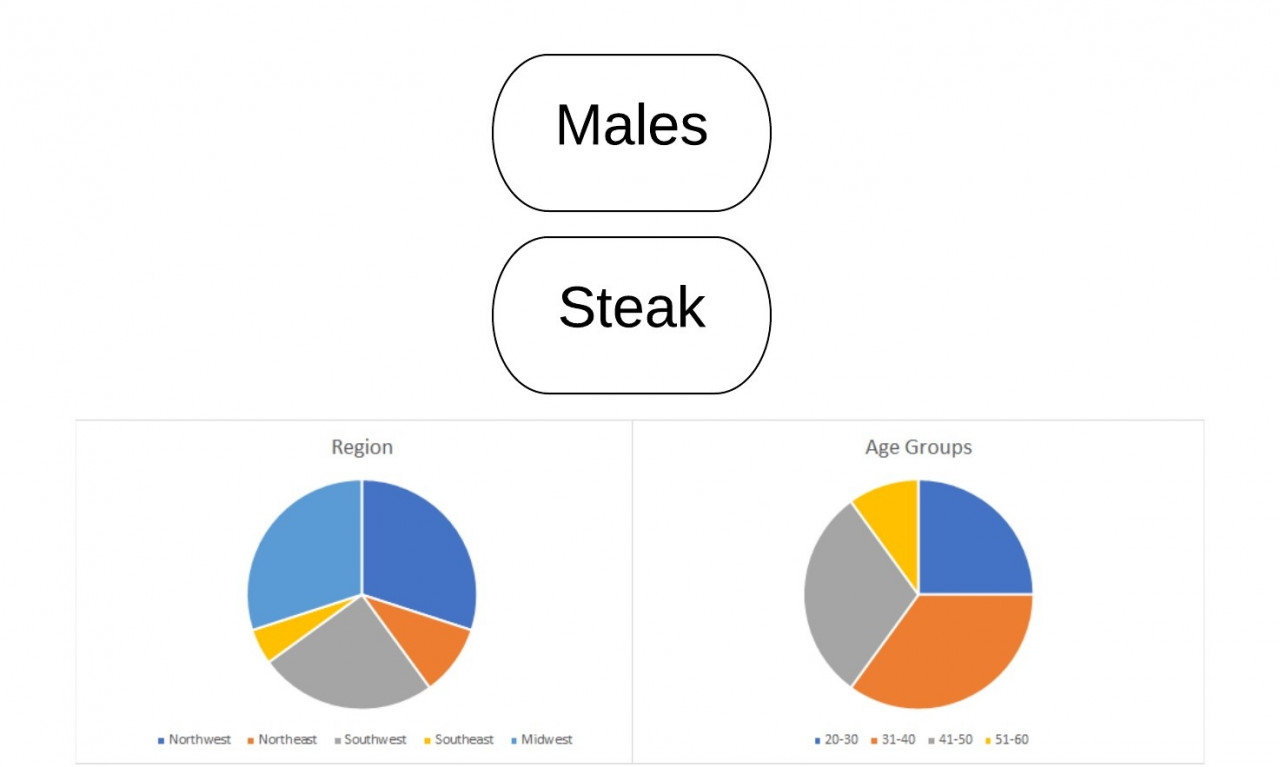
By making the selection of male or female a milestone, we can now determine that males from the southwest like steak the least, when compare to the other males from other regions. We can also tell that 31-40 year old males like steak the most.
Taken in conjunction with our previous abilities of understanding drop-off and field level statistics, we can apply an understanding as to who might also be at more of a risk to fall out of the application process. All this information taken together can help us be able to better understand what consumers use the applications, so that marketing efforts can be targeted at missing demographics or by knowing that certain demographics might be more receptive to the product.
I hope this has been insightful and that you now understand how milestones and segments can be used both separately or together and hat the arrangement of them in respect to an application can yield differing information.
Please reach out if you have questions about this.
Useful Videos
- Sending Segments from a Maestro Form
- Sending Milestones from a Maestro Form
- Milestones versus Segments
- Milestones, Segments, and the User Journey
When you subscribe to our announcements, we will send you an e-mail when there are new updates on the site so you won't miss them.