Debugging Guide
In general, debugging Transact Functions can be achieved by a few different techniques, each with their own different capabilities and advantages.
- Logging
- Unit Tests
- Debugger IDEs
Here are some of the relative advantages and disadvantages of each technique.
| Method | Advantages | Disadvantages |
|---|---|---|
| Logging |
|
|
| Unit tests |
|
|
| Debugger IDEs |
|
|
Logging
The Journey Manager server executes Groovy services inside a Groovy container and it is not possible to remotely attach a debugger to the executing container. Inside TM, logging is your only option to see what is happening at runtime.
The Logger object injected into form functions in TM provides excellent object dump capabilities. For example, the output below results from a single call to the logger to output the param FuncParam object passed to the form function's invoke method.
public class GetExchangeRate {
    public Logger logger
    FuncResult invoke(FuncParam param) {
        logger.info param
Logger output from the highlighted logger.info call above is:
07:45:58,064 INFO  com.avoka.tm.func.FuncParam@6cf4a83e[
trigger=Form Function
appDoc=[#document: null]
params={from=AUD, to=USD}
request=SecurityContextHolderAwareRequestWrapper[ FirewalledRequest[ HttpServletRequestImpl [ POST /web-plugin/servlet/FormDynamicDataServlet ]]]
svcDef=com.avoka.tm.vo.SvcDef@5df492ea[
id=450
name=Get Exchange Rate
versionNumber=0
version=0.1.0
orgId=3
clientCode=billfrost
type=Fluent Function
description=TODO...
isCurrentVersion=true
isJobTemplate=false
isUnitTestEnabled=true
className=com.avoka.fc.core.service.fluent.FluentFunctionService
createdAt=Thu Jan 25 09:09:38 AEDT 2018
createdBy=bill
lastModifiedAt=Mon Jan 29 07:45:29 AEDT 2018
lastModifiedBy=bill
svcConn=com.avoka.tm.vo.SvcConn@14087432[
id=27
name=Exchange Rate Connection
orgId=3
clientCode=billfrost
endpoint=http://api.fixer.io/latest
type=HTTP Endpoint
username=
password=
]
paramsMap={executionTimeout=0, groovyDebugLogging=false, groovyLoggingEnabled=true}
]
txn=com.avoka.tm.vo.Txn@efd2e26[
id=3473
orgId=3
clientCode=billfrost
orgName=Bill Frost Org
deliveryStatus=Not Ready
formId=747
formCode=exchangerate
formName=Exchange Rate
formStatus=Opened
groupNames=[]
spaceId=6
spaceName=Web Plug-in
timeCreated=Mon Jan 29 07:45:41 AEDT 2018
timeUserLastModified=Mon Jan 29 07:45:42 AEDT 2018
dataDeleted=false
submitKey=f4a96743adeb807f9d4f51384dcb1a75
trackingCode=W7DWFYW
userSaved=false
formVersionId=767
formVersionNumber=1.0-develop
formUrl=http://localhost:9080/web-plugin/servlet/SmartForm.html?submitKey=f4a96743adeb807f9d4f51384dcb1a75
receiptUrl=http://localhost:9080/web-plugin/servlet/FormReceipt.pdf?submitKey=f4a96743adeb807f9d4f51384dcb1a75
formDataMap={}
propertyMap={}
milestones=[formload]
formXml=
]
]
Logging in Unit Tests
Unit tests support logging while running inside TM, and while running under the SDK in your IDE. You can view logger output in the TM console or in your IDE's console output window.
Logging in Production
Anybody with sufficient credentials will be able to see logged messages in production even if they do not have an entitlement to access the logged information by other means.
note
Logging is simple and convenient, so take care in production environments to ensure that no sensitive or personally identifiable information is logged.
Unit Tests
Unit testing in JM and the Journey SDK is provided by JUnit. Unit testing is a standard part of any form function scaffolded by the SDK.
Unit testing is best practice and provides advantages that easily outweigh the relatively small cost of their development.
To take advantage of the features of a debugger, you must execute your function under test from a JUnit test class.
Mocking
One of the common techniques that accompanies unit testing is mocking and mocking frameworks.
Mocks are objects you create that appear to the function under test to be a real object, whereas it is actually just a stub that you manipulate in your unit test code to behave the way you want.
The Journey SDK provides several classes to support mocking in unit tests. For more information, see the Unit Testing Guide.
Debugger IDEs
The Journey SDK provides a local execution environment that supports debugging JUnit tests outside of Journey Manager. This method offers a richer development experience through access to debugging techniques such as setting breakpoints and inspecting the call stack or the contents of variables while paused.
Debugging form functions with a debugger is always done via JUnit tests. Using JUnit has some advantages over logging.
- You can have many different JUnit tests to exercise different conditions.
- You can use mocking to simulate a live environment.
- JUnit tests can be automated by SDK Ant tasks.
- Junit tests can be run in the TM console.
- JUnit tests can be run in your IDE, leveraging rich IDE debugging features.
To use the debugger you must always execute a Groovy unit test. It will in turn make a call to the invoke method of the form function it is exercising. You can set breakpoints wherever you want in the test or in the function code, but you always need to start by running the Groovy unit test code as a JUnit test first.
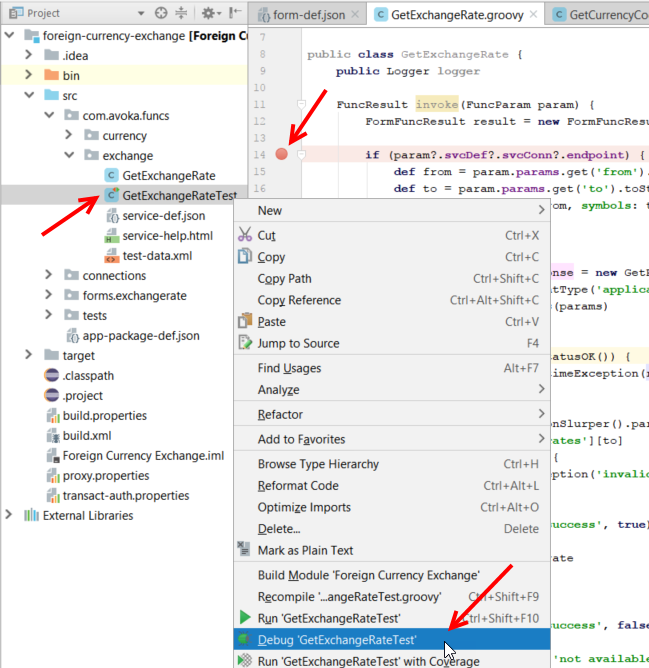
Debugging in the IDE is as simple as setting a breakpoint where you want, right-clicking on a Groovy unit test and selecting Debug from the context menu as shown below using IntelliJ.
In IntelliJ you can also click the Debug icon from the toolbar as shown below.
![]()
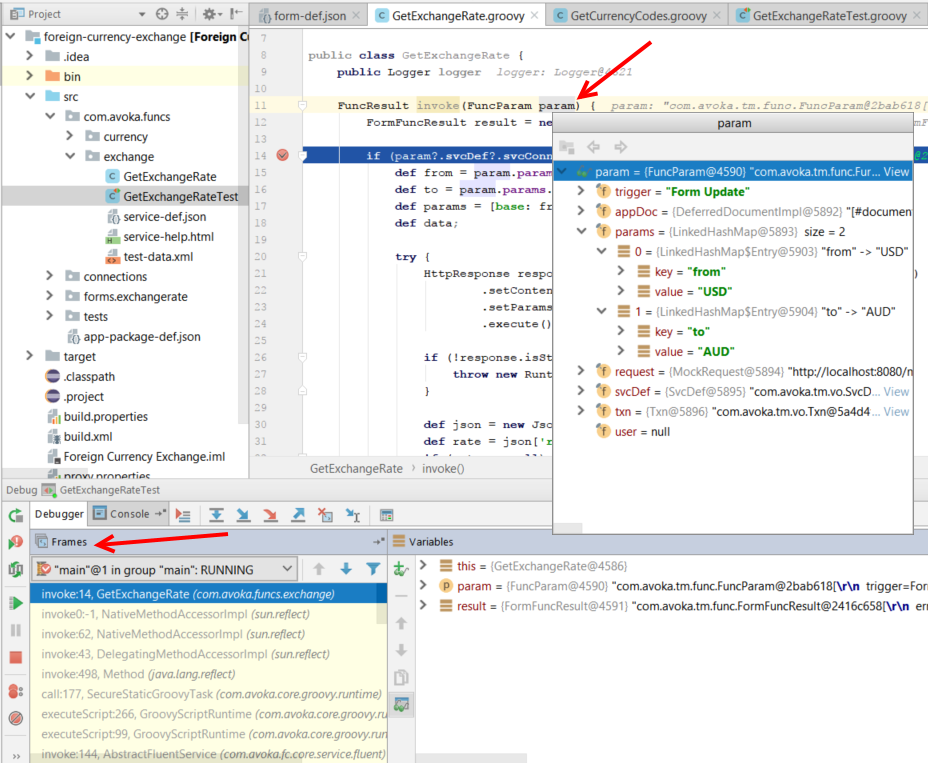
When the breakpoint is hit, you can view frames from the call stack, and can hover over a variable and inspect its content by clicking on it like this.